Fig. B.1
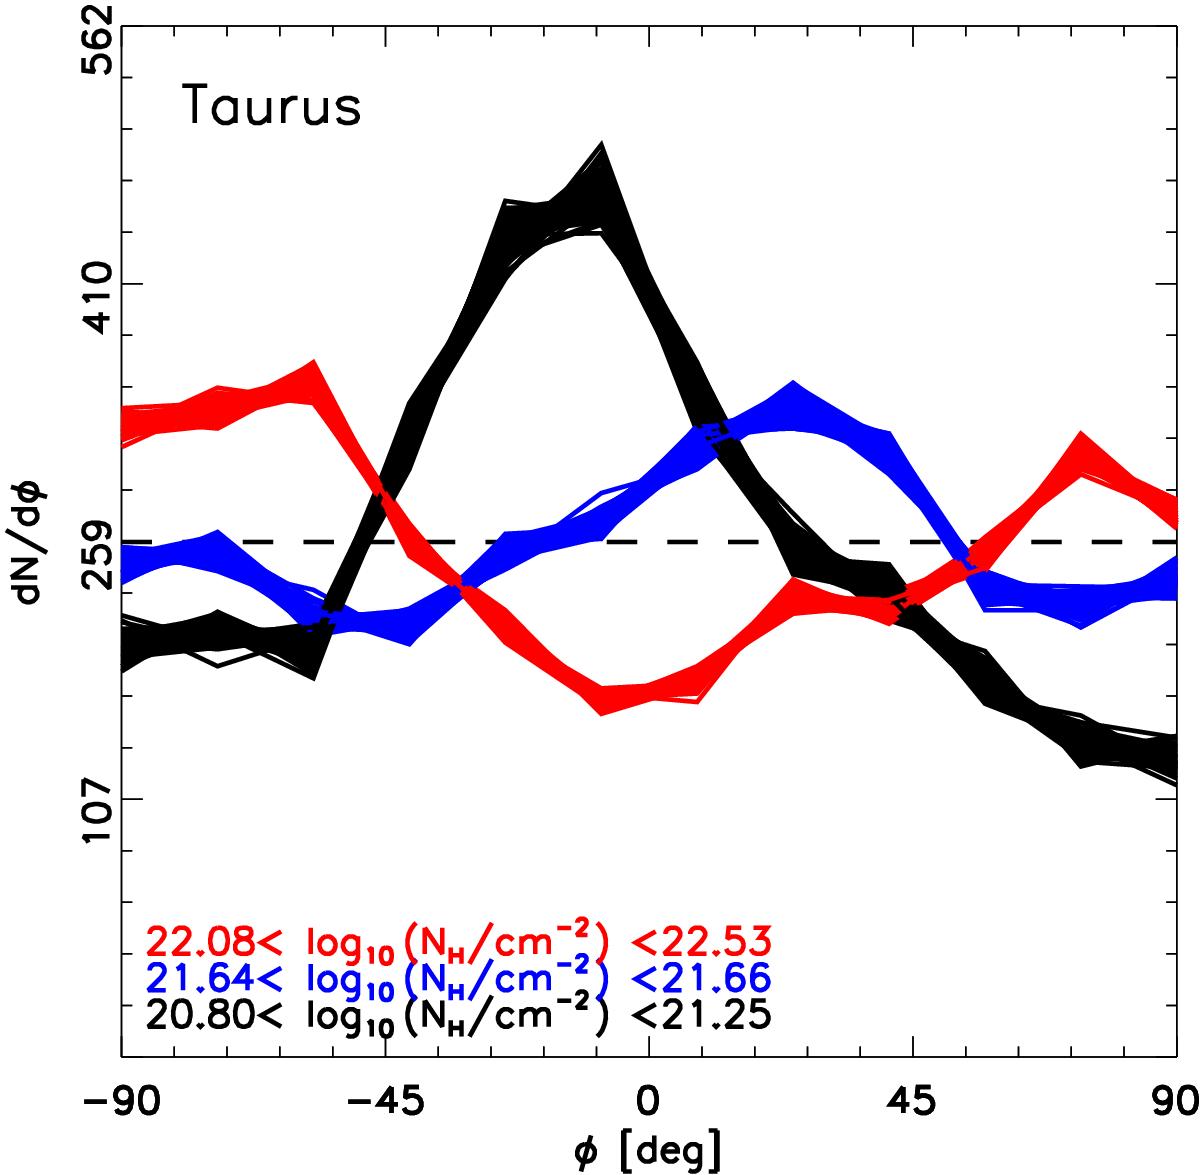
HROs in the Taurus region that correspond to the indicated NH bins. The plotted values are obtained using the original τ353 map at 10′ resolution and maps of the Stokes parameters Qr and Ur, which correspond to 1000 random noise realizations. Each realization is generated using a Gaussian probability density function centred on the measured values Q and U with variances ![]() and
and ![]() .
.
Current usage metrics show cumulative count of Article Views (full-text article views including HTML views, PDF and ePub downloads, according to the available data) and Abstracts Views on Vision4Press platform.
Data correspond to usage on the plateform after 2015. The current usage metrics is available 48-96 hours after online publication and is updated daily on week days.
Initial download of the metrics may take a while.