Fig. 11
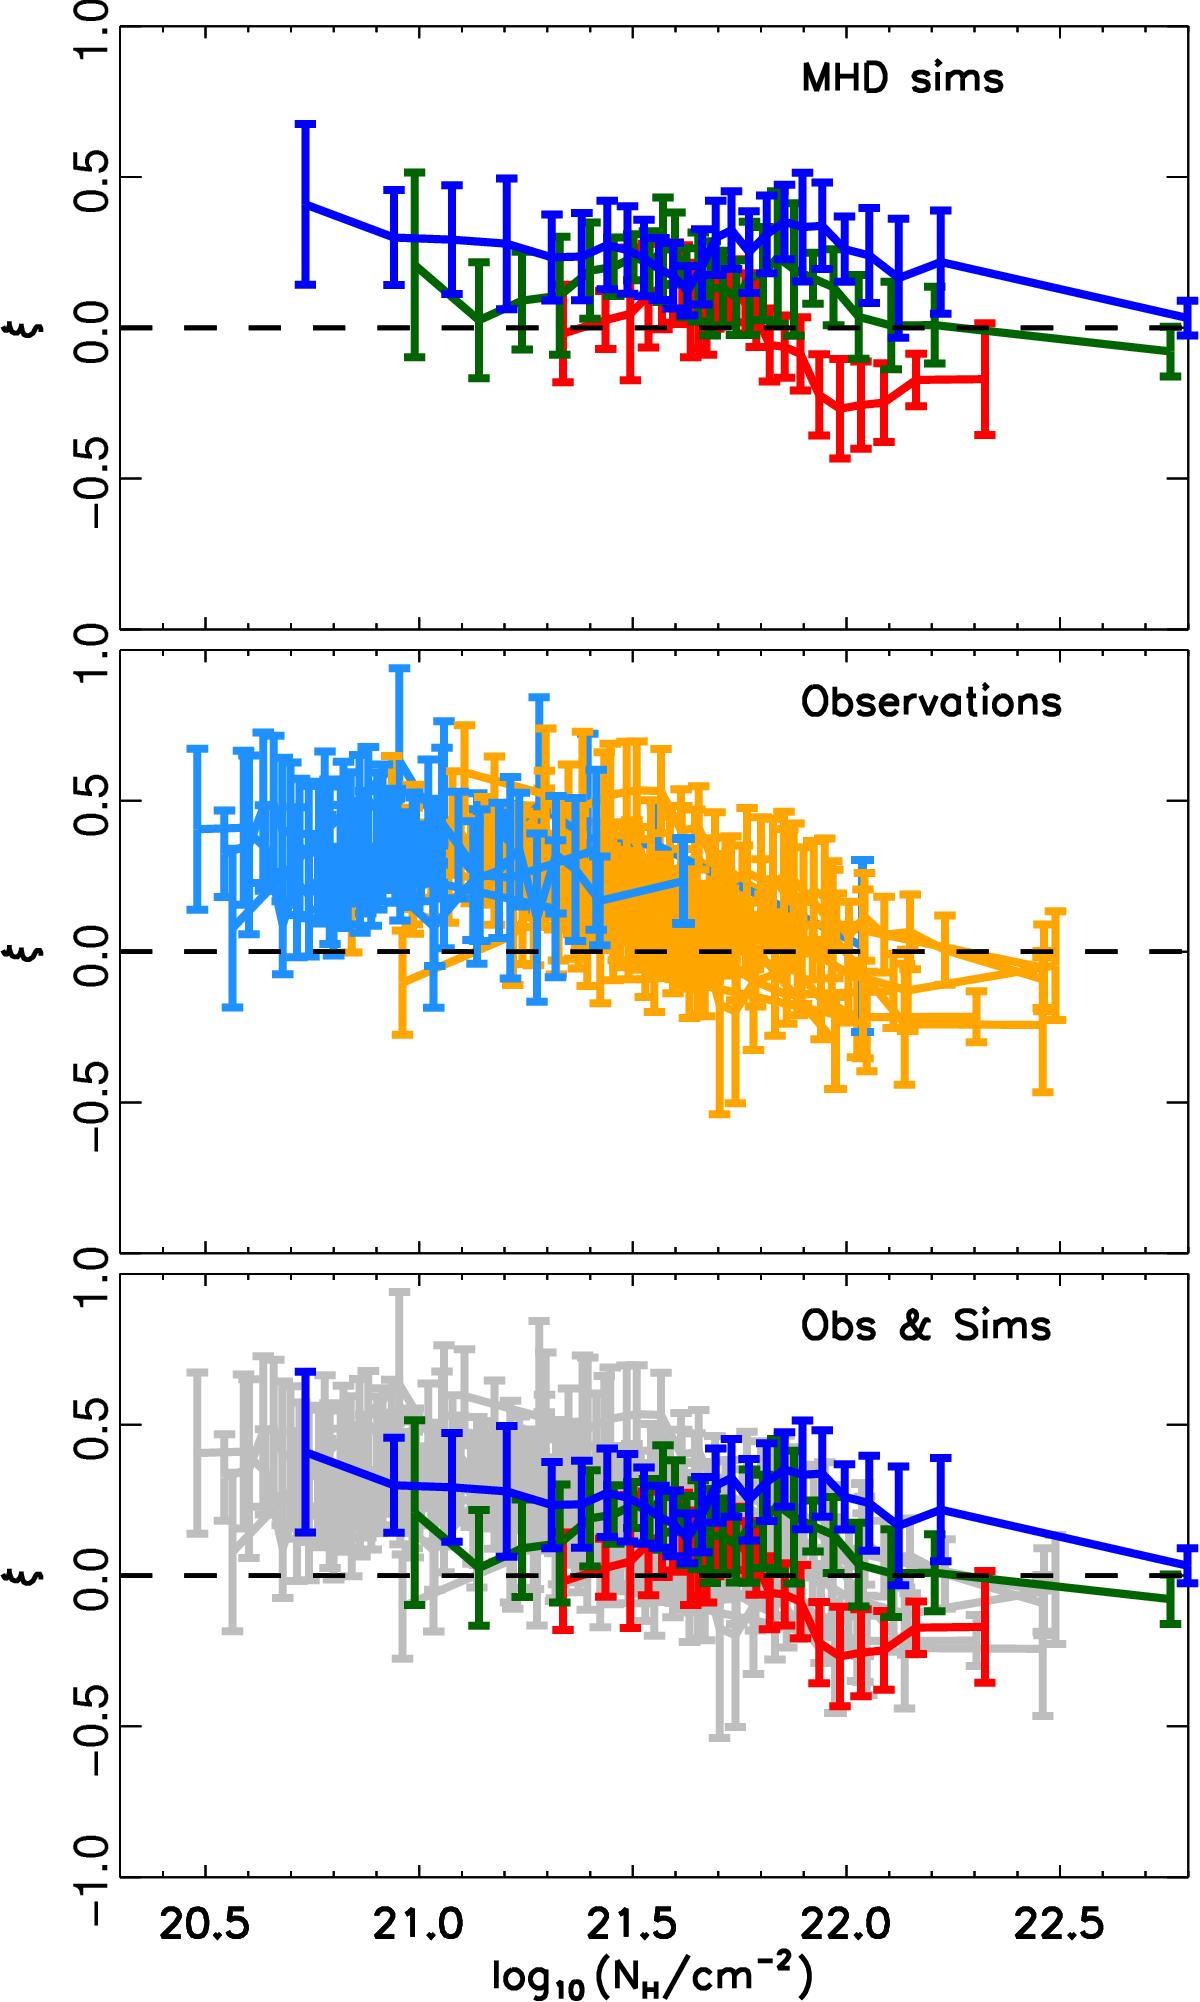
Histogram shape parameter ξ (Eqs. (4) and (5)) calculated for the different NH bins in each region. Top: relative orientation in synthetic observations of simulations with super-Alfvénic (blue), Alfvénic (green), and sub-Alfvénic (red) turbulence, as detailed in Soler et al. (2013). Middle: relative orientation in the regions selected from the Planck all-sky observations, from Fig. 7. The blue data points correspond to the lowest NH regions (CrA and the test regions in Fig. 8, ChamSouth and ChamEast) and the orange correspond to the rest of the clouds. Bottom: comparison between the trends in the synthetic observations (in colours) and the regions studied (grey). The observed smooth transition from mostly parallel (ξ> 0) to perpendicular (ξ< 0) is similar to the transition in the simulations for which the turbulence is Alfvénic or sub-Alfvéic.
Current usage metrics show cumulative count of Article Views (full-text article views including HTML views, PDF and ePub downloads, according to the available data) and Abstracts Views on Vision4Press platform.
Data correspond to usage on the plateform after 2015. The current usage metrics is available 48-96 hours after online publication and is updated daily on week days.
Initial download of the metrics may take a while.