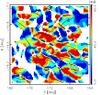
Fig. 9
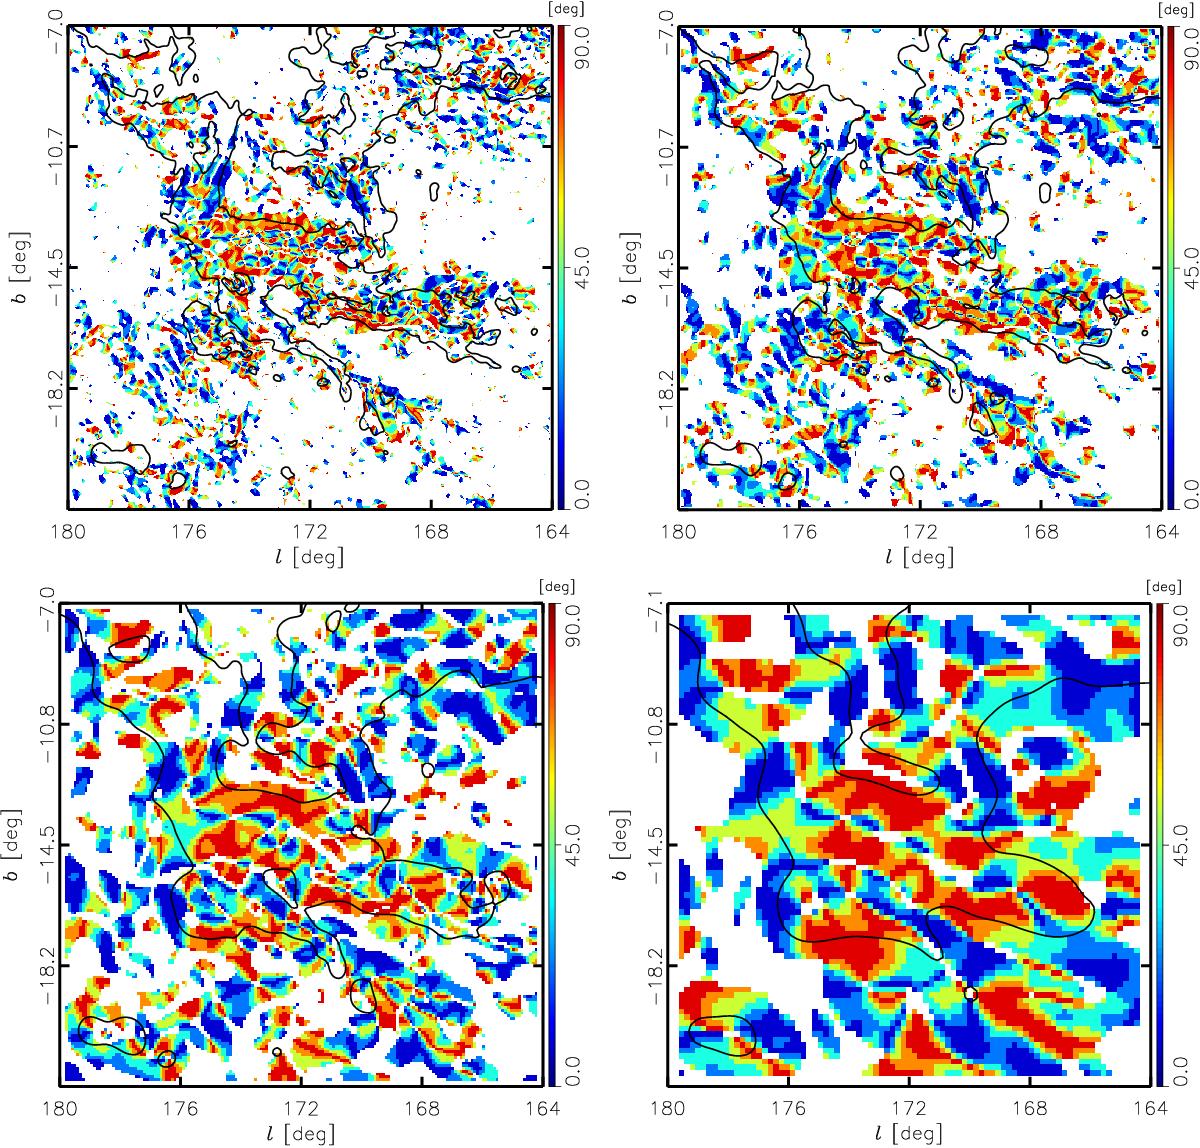
Maps of the absolute value of the relative orientation angle, | φ |, in the Taurus region. These maps are produced after smoothing the input maps to beam FWHMs of 10′, 15′, 30′, and 60′ and then resampling the grid to sample each beam FWHM with the same number of pixels. The regions in red correspond to B⊥ close to perpendicular to NH structures. The regions in blue correspond to B⊥ close to parallel to NH structures. The black contour, corresponding to the NH value of the intermediate contour introduced in Fig. 3, provides a visual reference to the cloud structure.
Current usage metrics show cumulative count of Article Views (full-text article views including HTML views, PDF and ePub downloads, according to the available data) and Abstracts Views on Vision4Press platform.
Data correspond to usage on the plateform after 2015. The current usage metrics is available 48-96 hours after online publication and is updated daily on week days.
Initial download of the metrics may take a while.