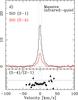
Fig. 9
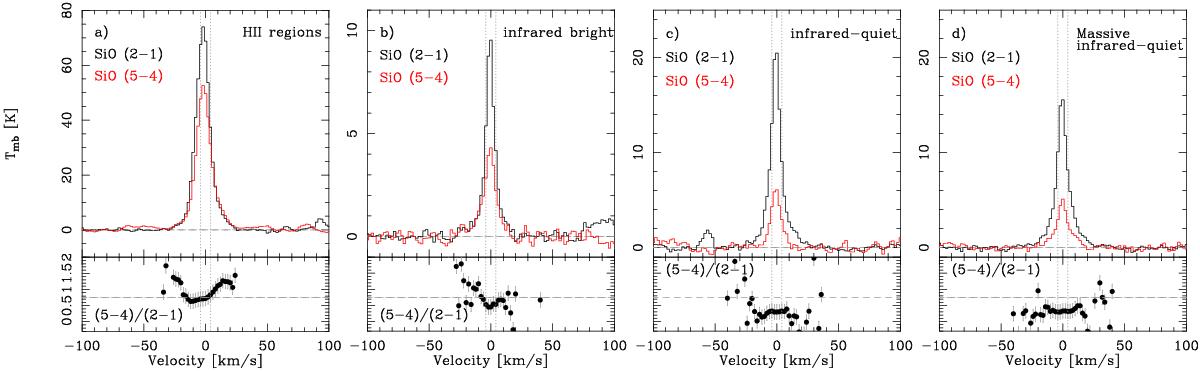
Averaged, distance weighted line profiles. The SiO (2–1) line is shown in black, while the SiO (5–4) line is red. Dotted grey line indicates the velocity range Δv = 8 km s-1 with respect to the averaged line centre. The panel a) corresponds to the H II regions; b) shows the infrared-bright sources; c) shows the infrared-quiet sample; and d) shows a subset of the infrared-quiet sample, where 1 <d< 7 kpc and M> 650M⊙. The bottom panels show the ratio of the 5−4 over the 2−1 line intensity per 2 km s-1 velocity bins.For a better comparison, a ratio of 0.75 is indicated with dotted grey line.
Current usage metrics show cumulative count of Article Views (full-text article views including HTML views, PDF and ePub downloads, according to the available data) and Abstracts Views on Vision4Press platform.
Data correspond to usage on the plateform after 2015. The current usage metrics is available 48-96 hours after online publication and is updated daily on week days.
Initial download of the metrics may take a while.