Free Access
Fig. 8
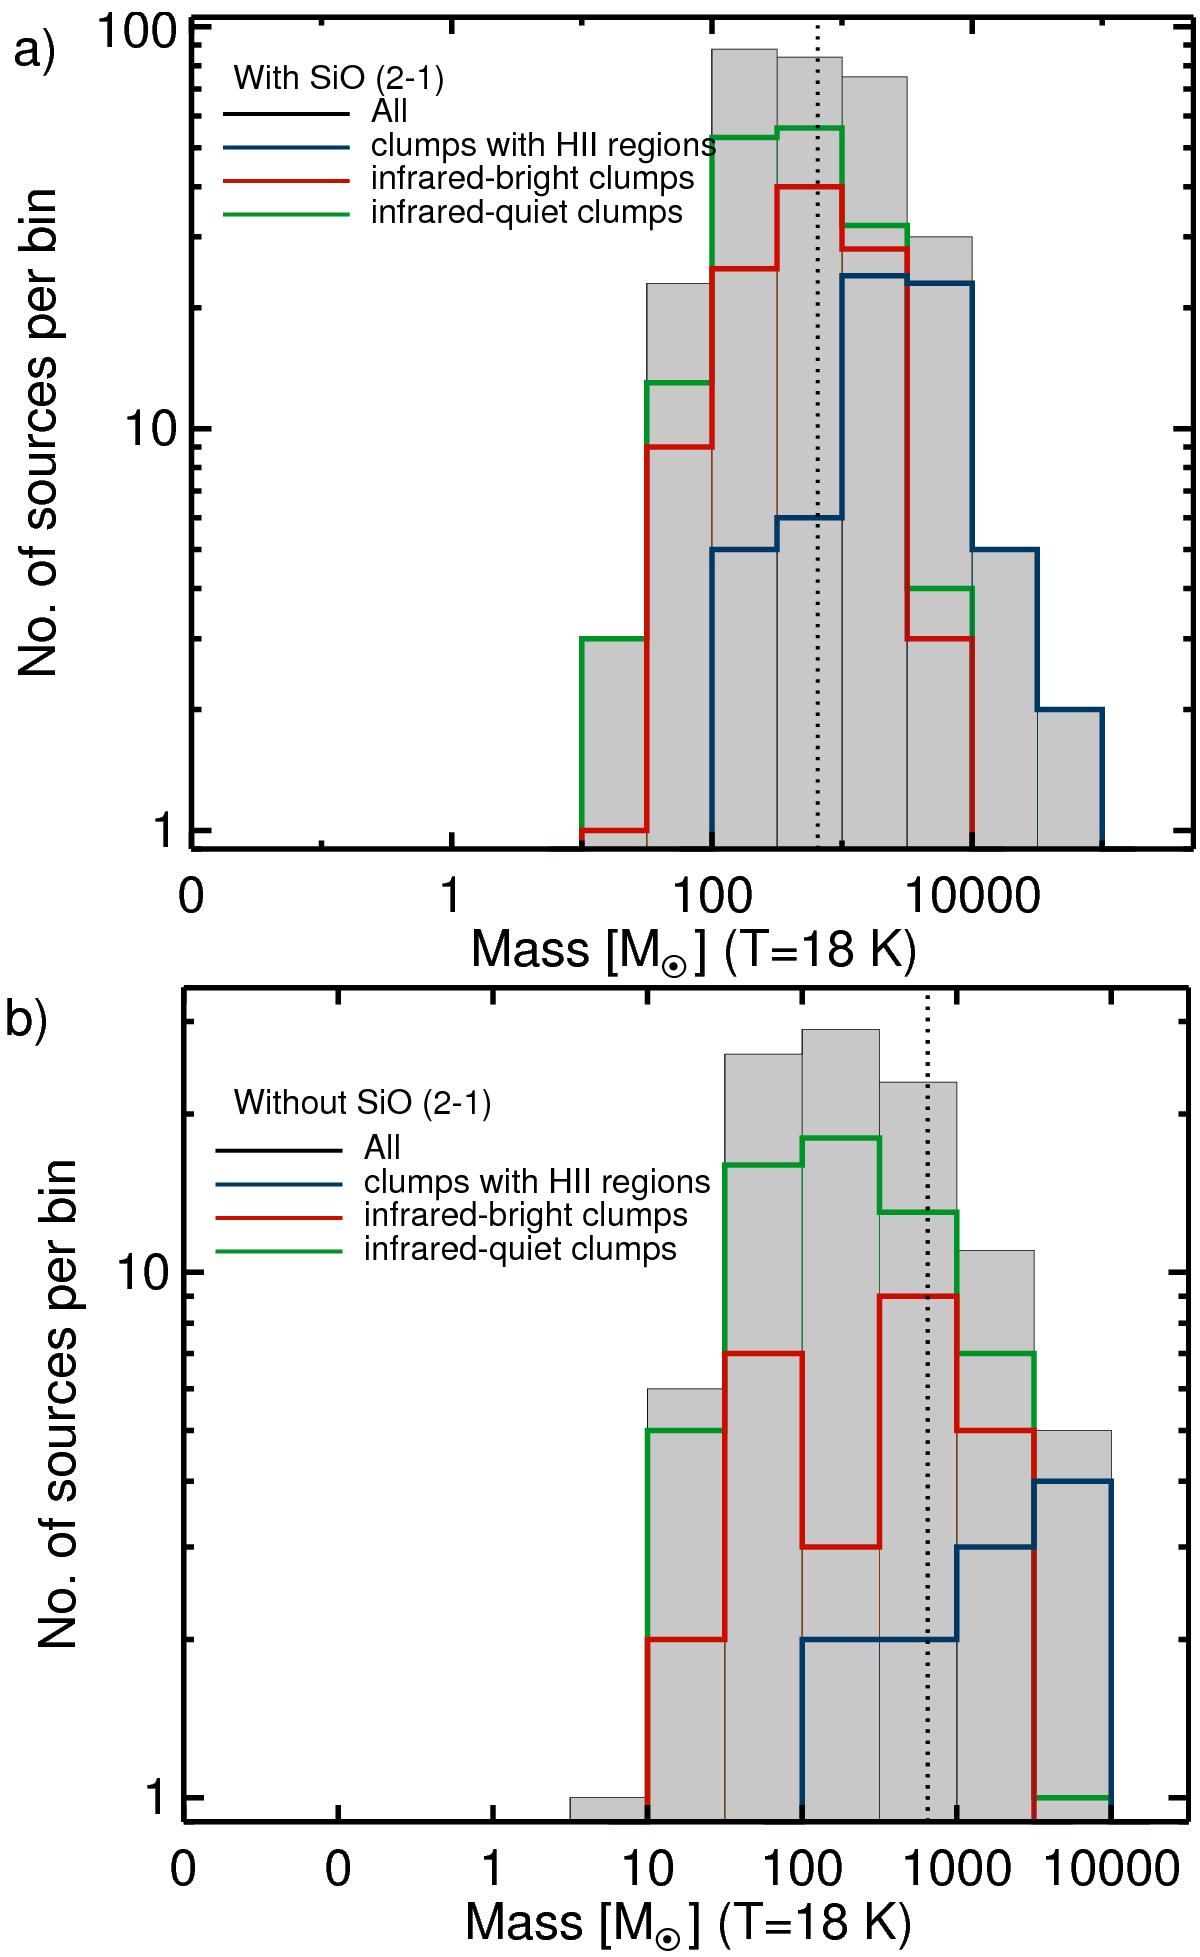
Histogram of the massive clumps with (top) and lacking (bottom) SiO (2−1) detection from the entire sample and the different categories labelled. The dashed line corresponds to 650 M⊙, which is a crude limit for clumps to form massive stars. Colours are the same as in Fig. 2.
This figure is made of several images, please see below:
Current usage metrics show cumulative count of Article Views (full-text article views including HTML views, PDF and ePub downloads, according to the available data) and Abstracts Views on Vision4Press platform.
Data correspond to usage on the plateform after 2015. The current usage metrics is available 48-96 hours after online publication and is updated daily on week days.
Initial download of the metrics may take a while.