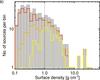
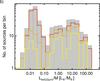
Fig. 5
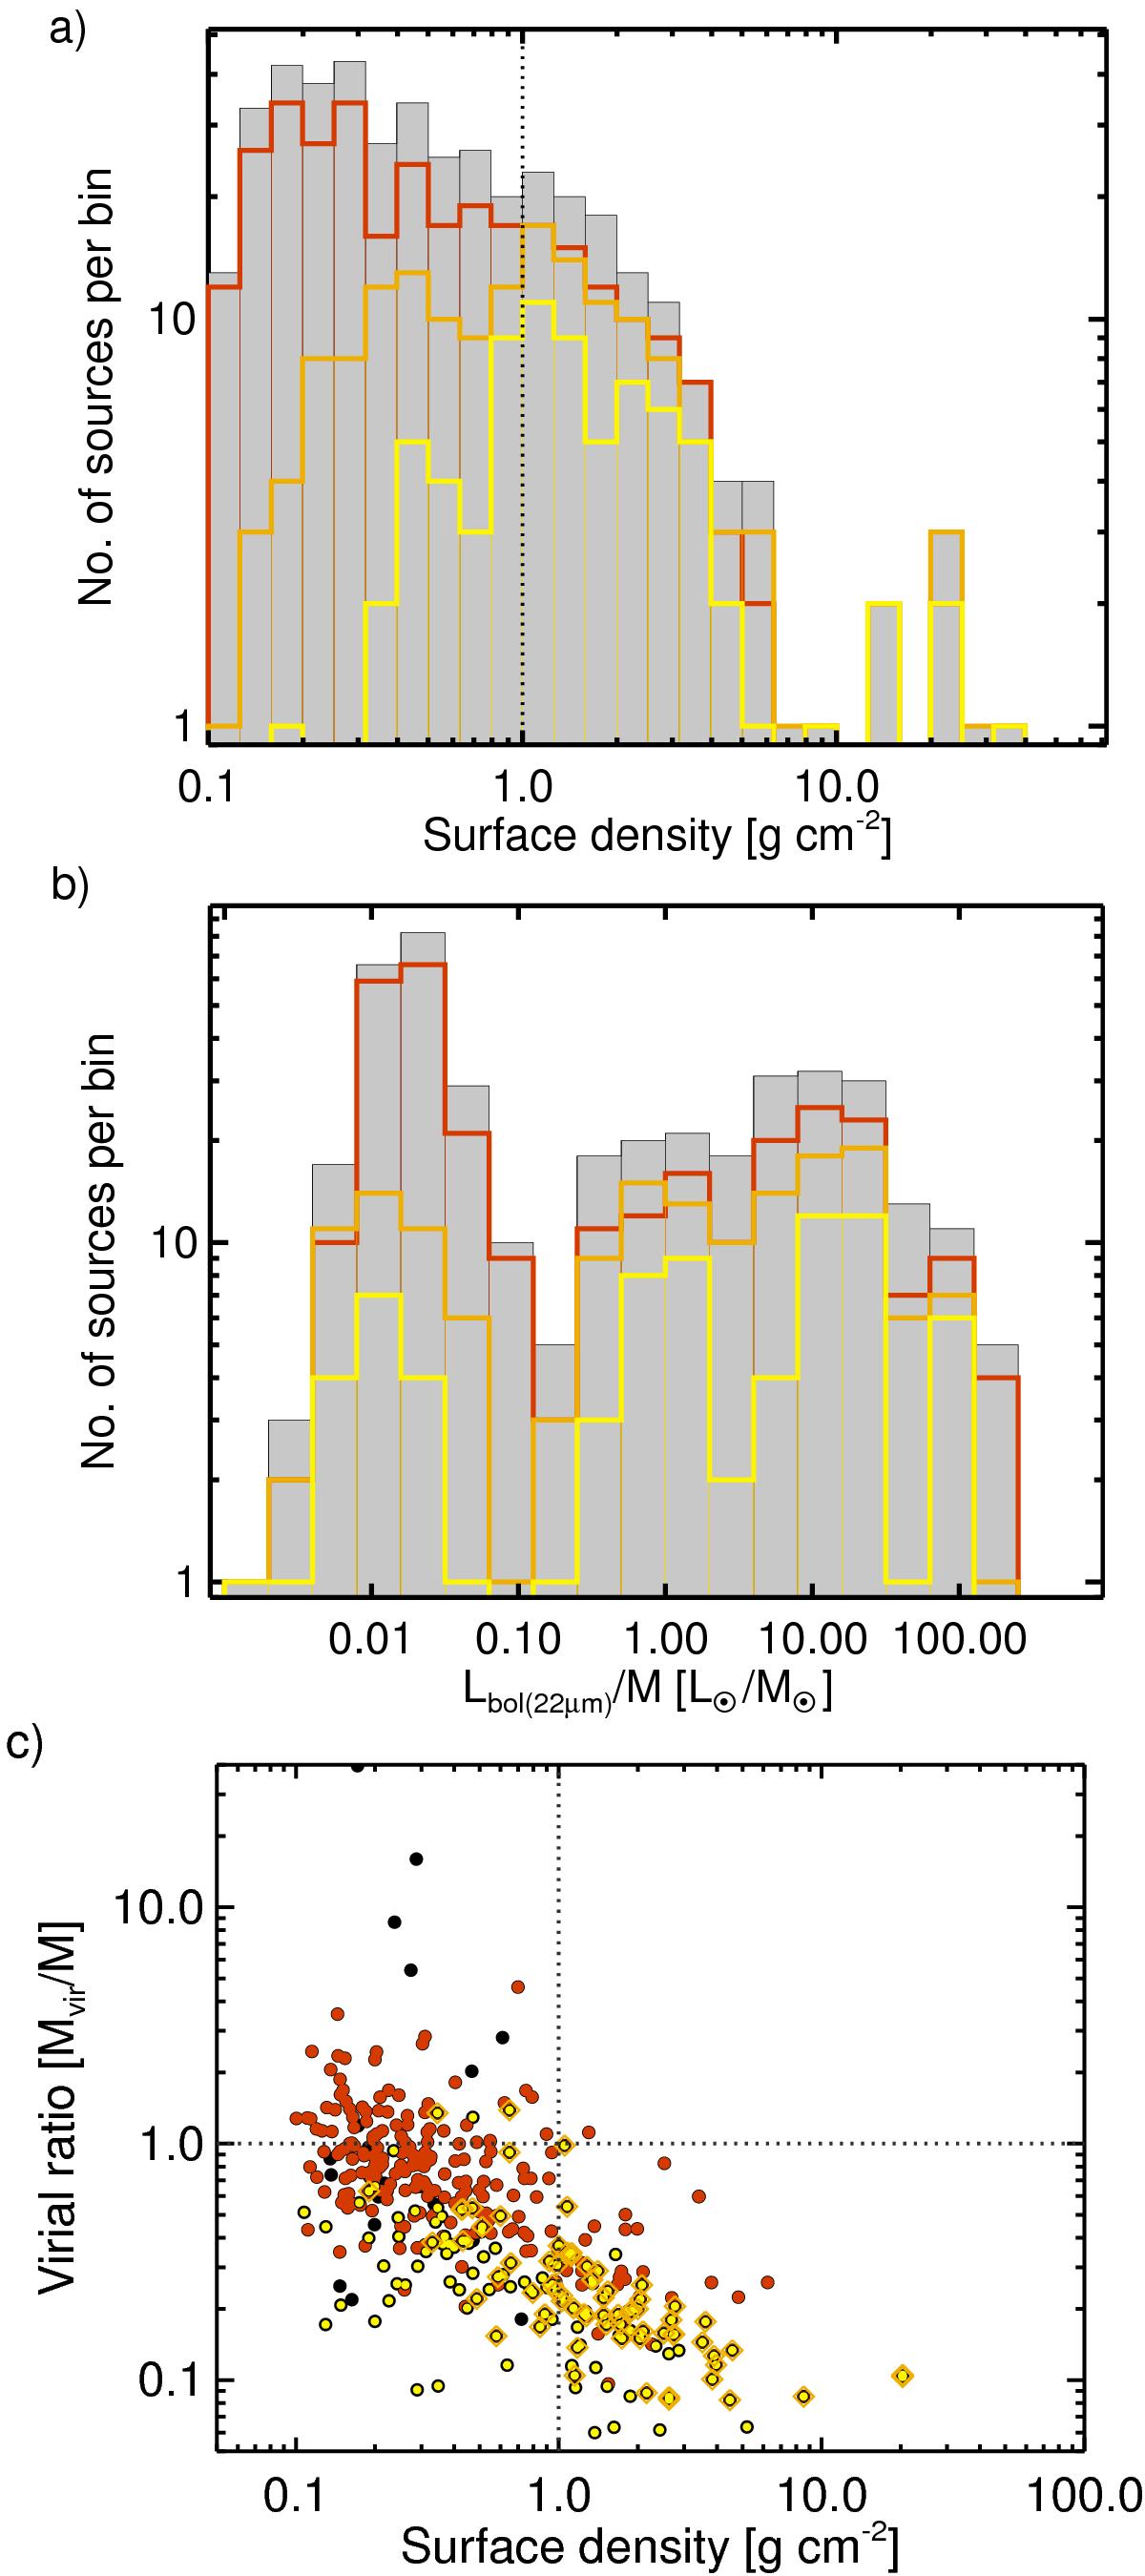
a) Histogram of the surface density of all sources, the dark orange, orange, and yellow histograms correspond to the distance, mass, and both mass- and distance-limited subsamples, respectively. b) Histogram of Lbol/M [L⊙/M⊙]. The lines are the same as on panel a). c) Surface density versus ratio of Mvir/M. The colour codes are the same as for panels a) and b). Dotted lines show the line of Mvir = M, and a surface density of 1 g cm-2. The properties of the selected subsamples are discussed in Sect. 3.5.
Current usage metrics show cumulative count of Article Views (full-text article views including HTML views, PDF and ePub downloads, according to the available data) and Abstracts Views on Vision4Press platform.
Data correspond to usage on the plateform after 2015. The current usage metrics is available 48-96 hours after online publication and is updated daily on week days.
Initial download of the metrics may take a while.