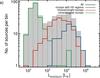
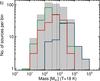
Fig. 4
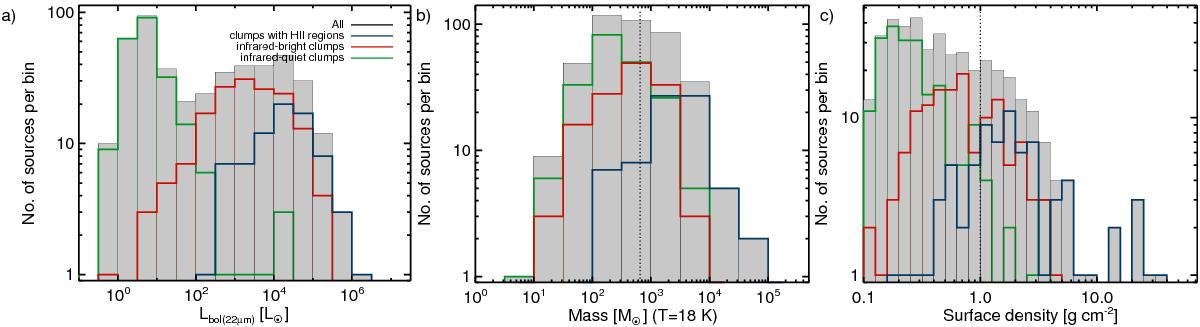
a) Histograms of the bolometric luminosity extrapolated from the monochromatic luminosity at 22 μm from Mottram et al. (2011), b) the mass, and c) the surface density for the whole sample. The dotted line in panel b) shows the mass limit of 650 M⊙. The dashed line in panel c) show the theoretical value of 1 g cm-2 from (Krumholz & McKee 2008). The colour scheme is the same as in Fig. 2 and is indicated in the legend of panel a).
Current usage metrics show cumulative count of Article Views (full-text article views including HTML views, PDF and ePub downloads, according to the available data) and Abstracts Views on Vision4Press platform.
Data correspond to usage on the plateform after 2015. The current usage metrics is available 48-96 hours after online publication and is updated daily on week days.
Initial download of the metrics may take a while.