Free Access
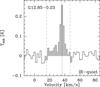
Fig. E.3
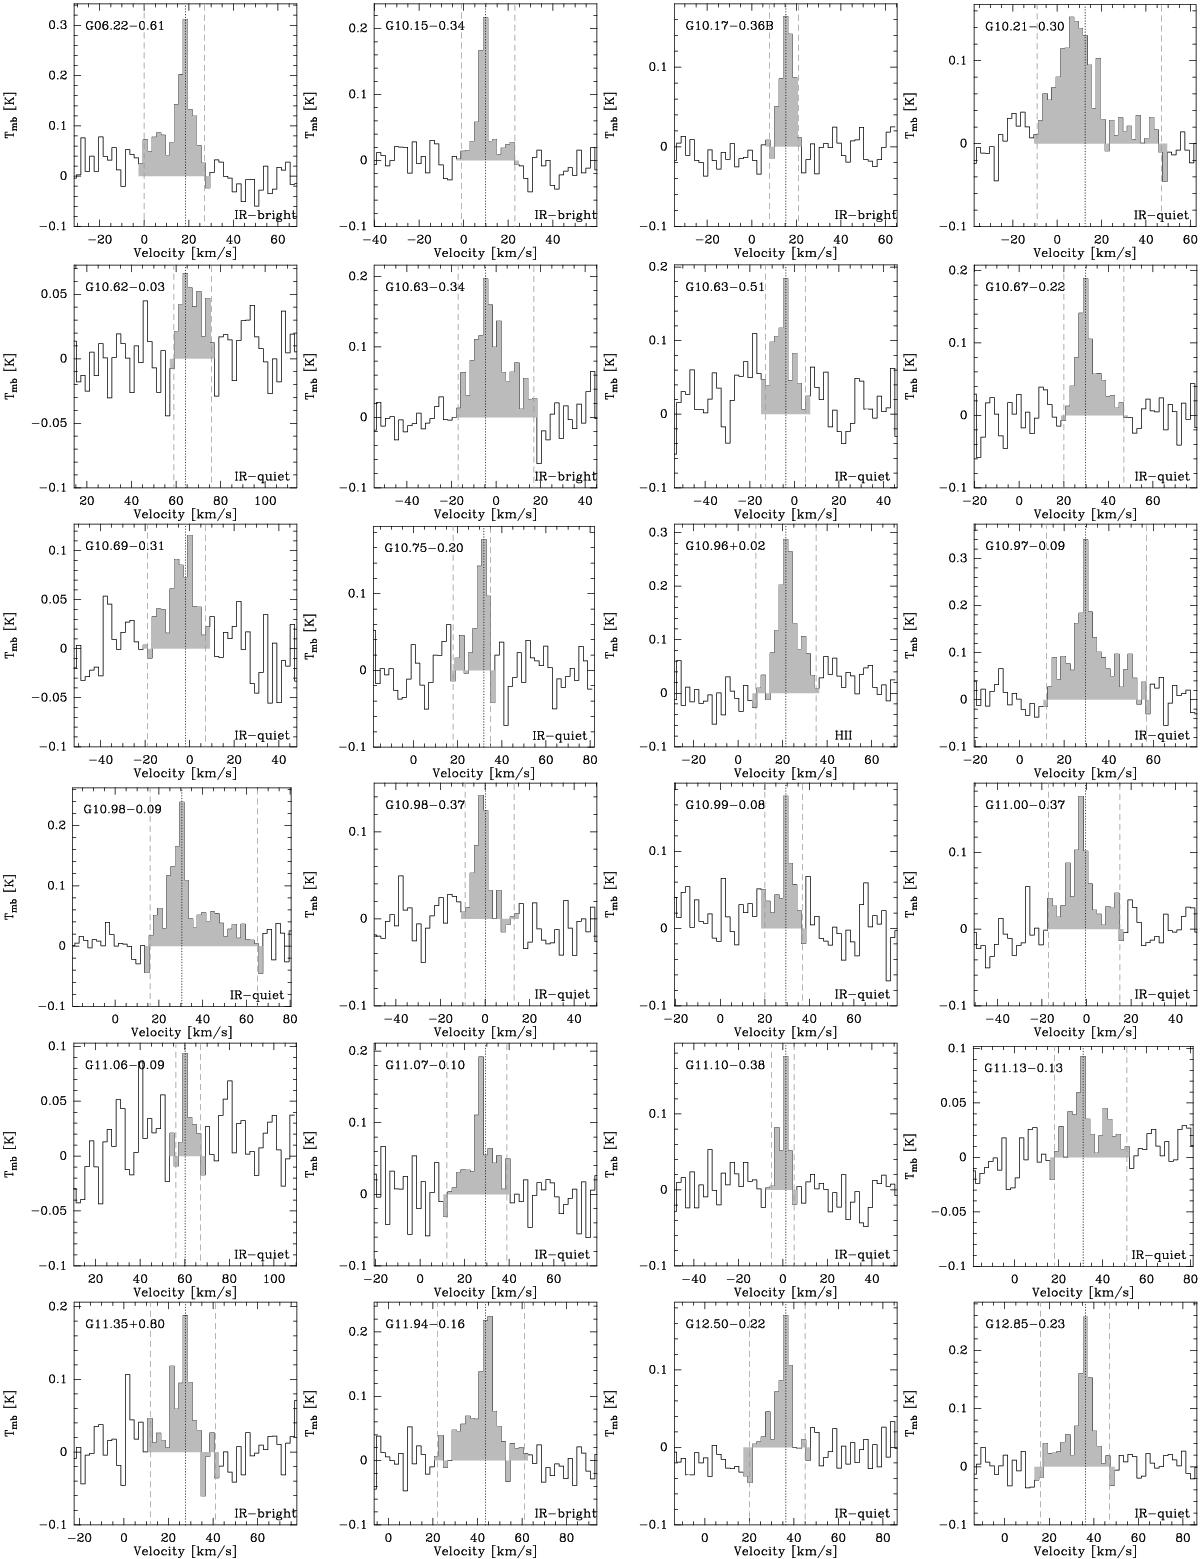
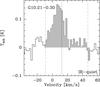
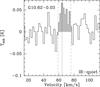
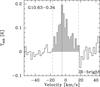
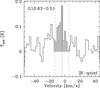
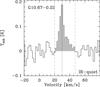
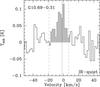
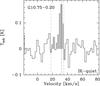
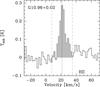
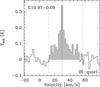
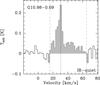
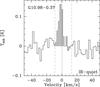
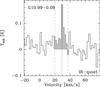
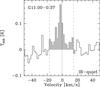
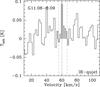
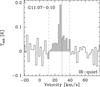
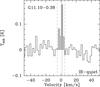
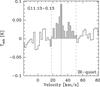
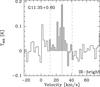
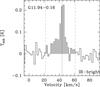
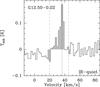
Spectra of the SiO (2−1) transition is shown in black with the area of the FWZP shown in grey. Dotted line shows the systemic velocity of the source (vlsr, see also Table 6), dashed lines correspond to the velocity range determined from the SiO (2−1) transition.
This figure is made of several images, please see below:
Current usage metrics show cumulative count of Article Views (full-text article views including HTML views, PDF and ePub downloads, according to the available data) and Abstracts Views on Vision4Press platform.
Data correspond to usage on the plateform after 2015. The current usage metrics is available 48-96 hours after online publication and is updated daily on week days.
Initial download of the metrics may take a while.