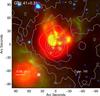
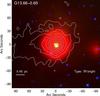
Fig. 3
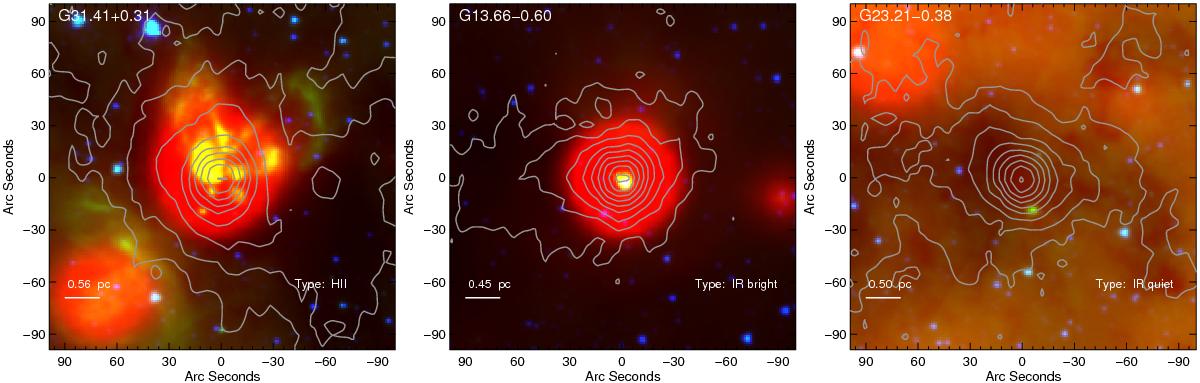
Examples of sources in different classes are shown from left to right: massive clumps hosting embedded UC-H II region, infrared-bright source, and an infrared-quiet massive clump. The background image is a three colour composite image from Spitzer 3.6 μm (blue), 8 μm (green), and WISE 22 μm (red) band images. Grey contours show the 870 μm emission from ATLASGAL. White labels show the source name, the classification of the source, and a bar shows the physical scale considering the distance of the source.
Current usage metrics show cumulative count of Article Views (full-text article views including HTML views, PDF and ePub downloads, according to the available data) and Abstracts Views on Vision4Press platform.
Data correspond to usage on the plateform after 2015. The current usage metrics is available 48-96 hours after online publication and is updated daily on week days.
Initial download of the metrics may take a while.