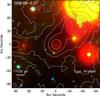
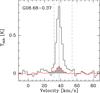
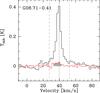
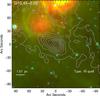
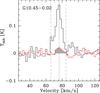
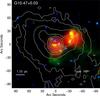
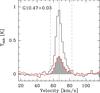
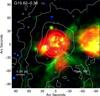
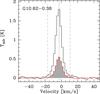
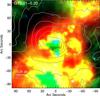
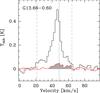
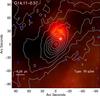
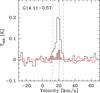
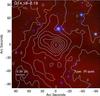
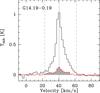
Fig. E.1
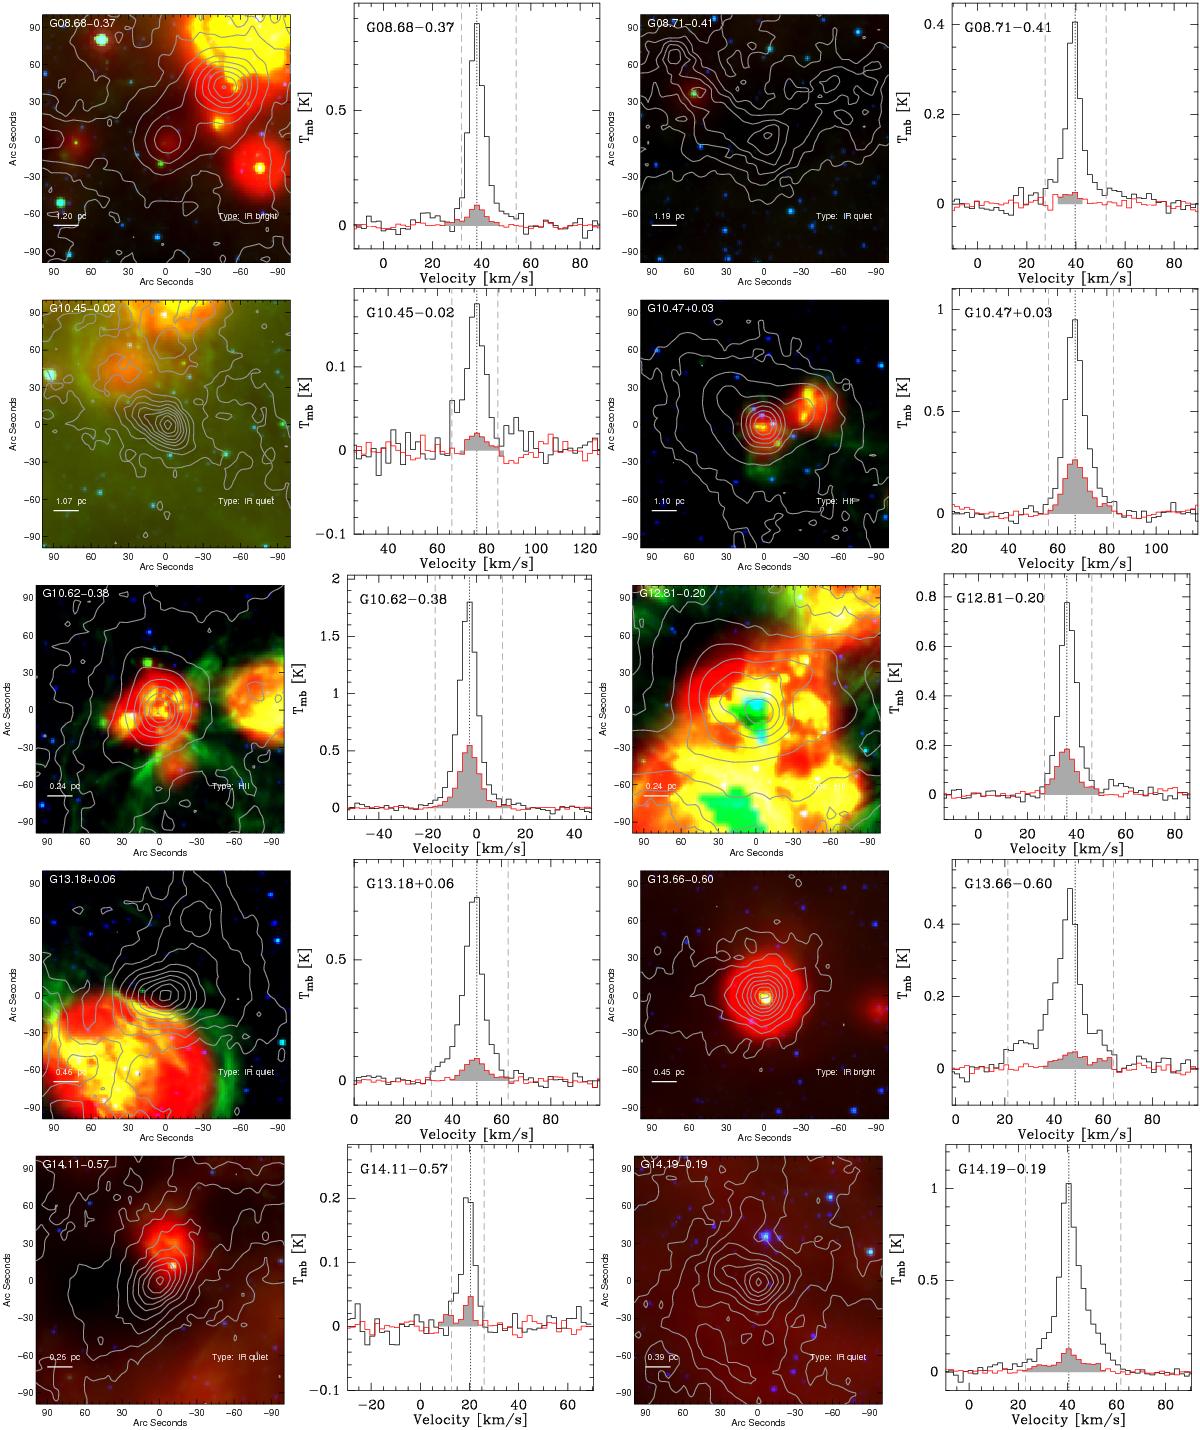
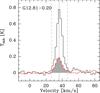
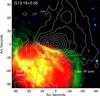
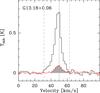
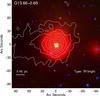
Left: the colour plots show a three-colour composite image from Spitzer 3.6 μm (blue), 8 μm (green), and WISE 22 μm (red) band images, similar to Fig. 3. Grey contours show the 870 μm emission from ATLASGAL. White labels show the source name, the classification of the source, and a bar shows the physical scale considering the distance of the source. Right: the spectra of the SiO (2−1) transition is shown in black and the 5−4 in red. Grey shaded area shows the velocity range used to determine the integrated emission. Dotted line shows the systemic velocity of the source (vlsr, see also Table 6), dashed lines correspond to the velocity range determined from the SiO (2−1) transition. Light grey dotted lines show the velocity range of the 5−4 transition. These plots are first shown for the targets of the first IRAM 30 m observing campaign.
Current usage metrics show cumulative count of Article Views (full-text article views including HTML views, PDF and ePub downloads, according to the available data) and Abstracts Views on Vision4Press platform.
Data correspond to usage on the plateform after 2015. The current usage metrics is available 48-96 hours after online publication and is updated daily on week days.
Initial download of the metrics may take a while.