Fig. D.1
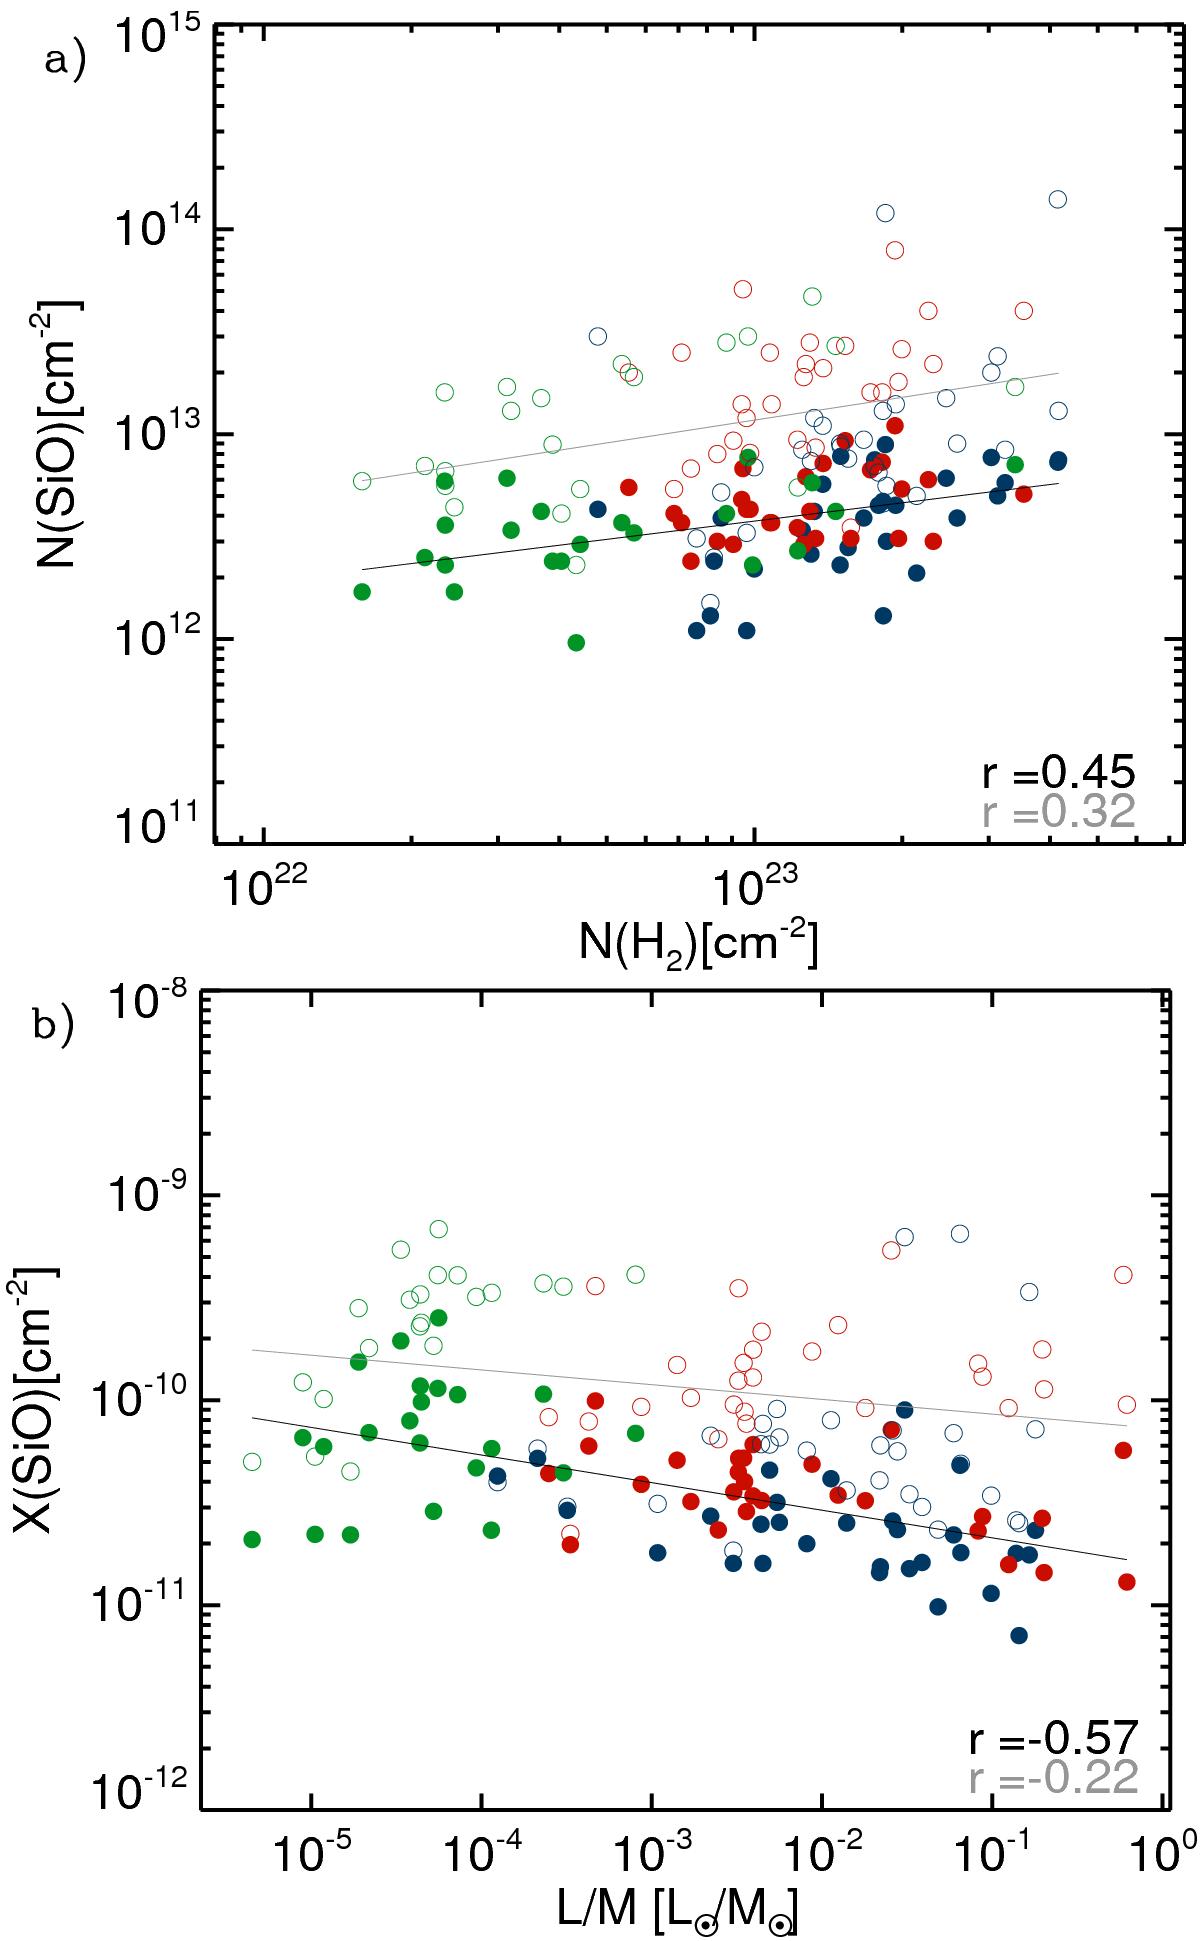
a) Column density of SiO estimated from the ratio of the (5–4) to (2–1) transitions with RADEX, versus column density derived from the 870 μm integrated flux density from Csengeri et al. (2014). Filled symbols correspond to the calculations assuming uniform beam filling, while circles show the calculations with a fixed angular size of 8′′ at 1 kpc, and scaled to the distance of the sources. The fit to the data are shown in black and grey lines, respectively. The coefficient of the Spearman-rank correlation test is shown in the figure. The correlation is weaker for the calculations taking the distances into account. b) Abundance of SiO estimated as described in Sect 5.3. Symbols are the same as on panel a).
Current usage metrics show cumulative count of Article Views (full-text article views including HTML views, PDF and ePub downloads, according to the available data) and Abstracts Views on Vision4Press platform.
Data correspond to usage on the plateform after 2015. The current usage metrics is available 48-96 hours after online publication and is updated daily on week days.
Initial download of the metrics may take a while.