Free Access
Fig. 2
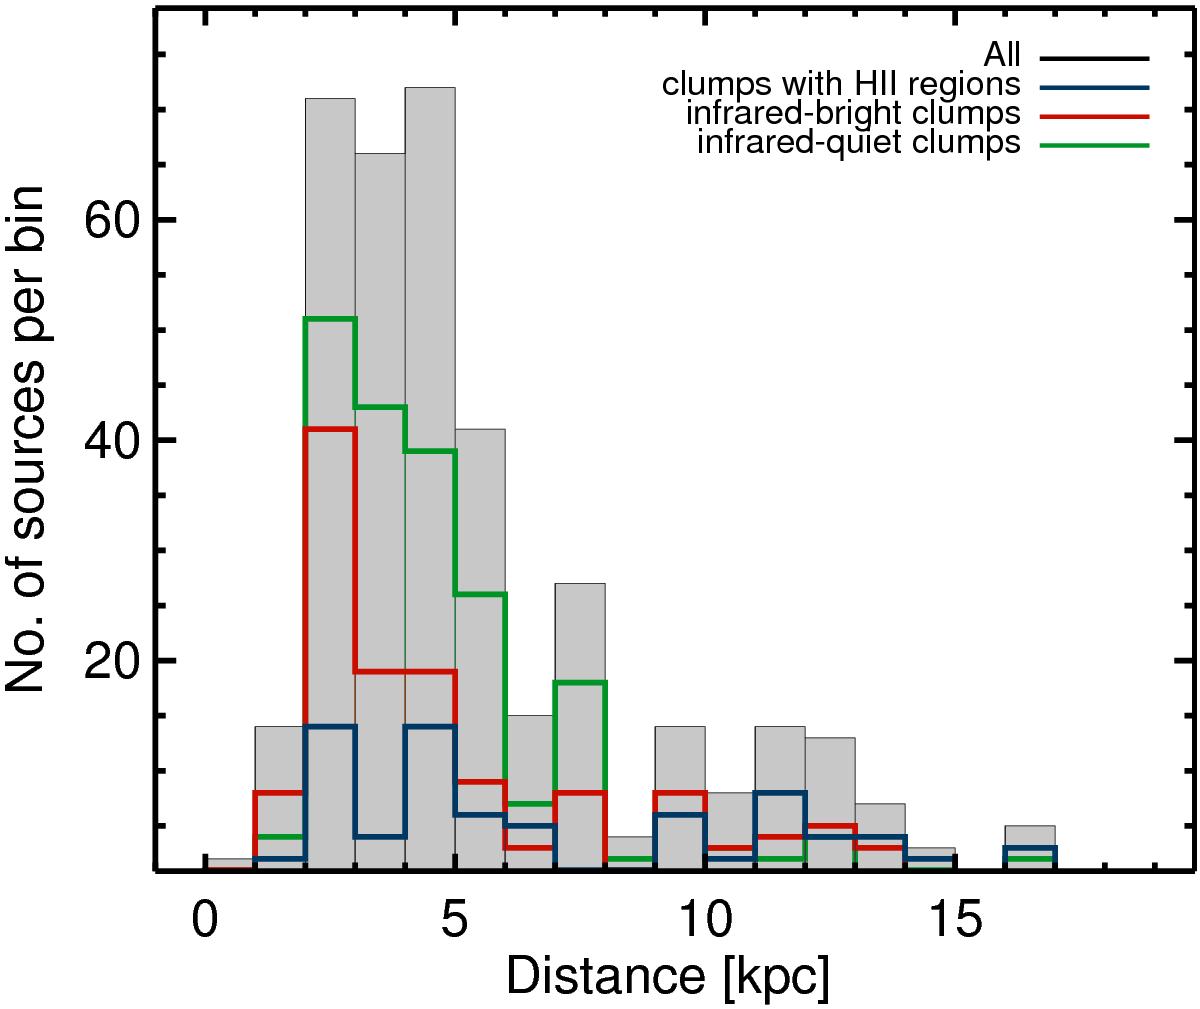
Distance distribution of the whole sample with the different source types indicated in colours. Black line with grey filling corresponds to the whole sample, blue shows the genuine H II regions, red corresponds to clumps with embedded protostars, and the green histogram shows the infrared-quiet clumps.
Current usage metrics show cumulative count of Article Views (full-text article views including HTML views, PDF and ePub downloads, according to the available data) and Abstracts Views on Vision4Press platform.
Data correspond to usage on the plateform after 2015. The current usage metrics is available 48-96 hours after online publication and is updated daily on week days.
Initial download of the metrics may take a while.