Fig. 18
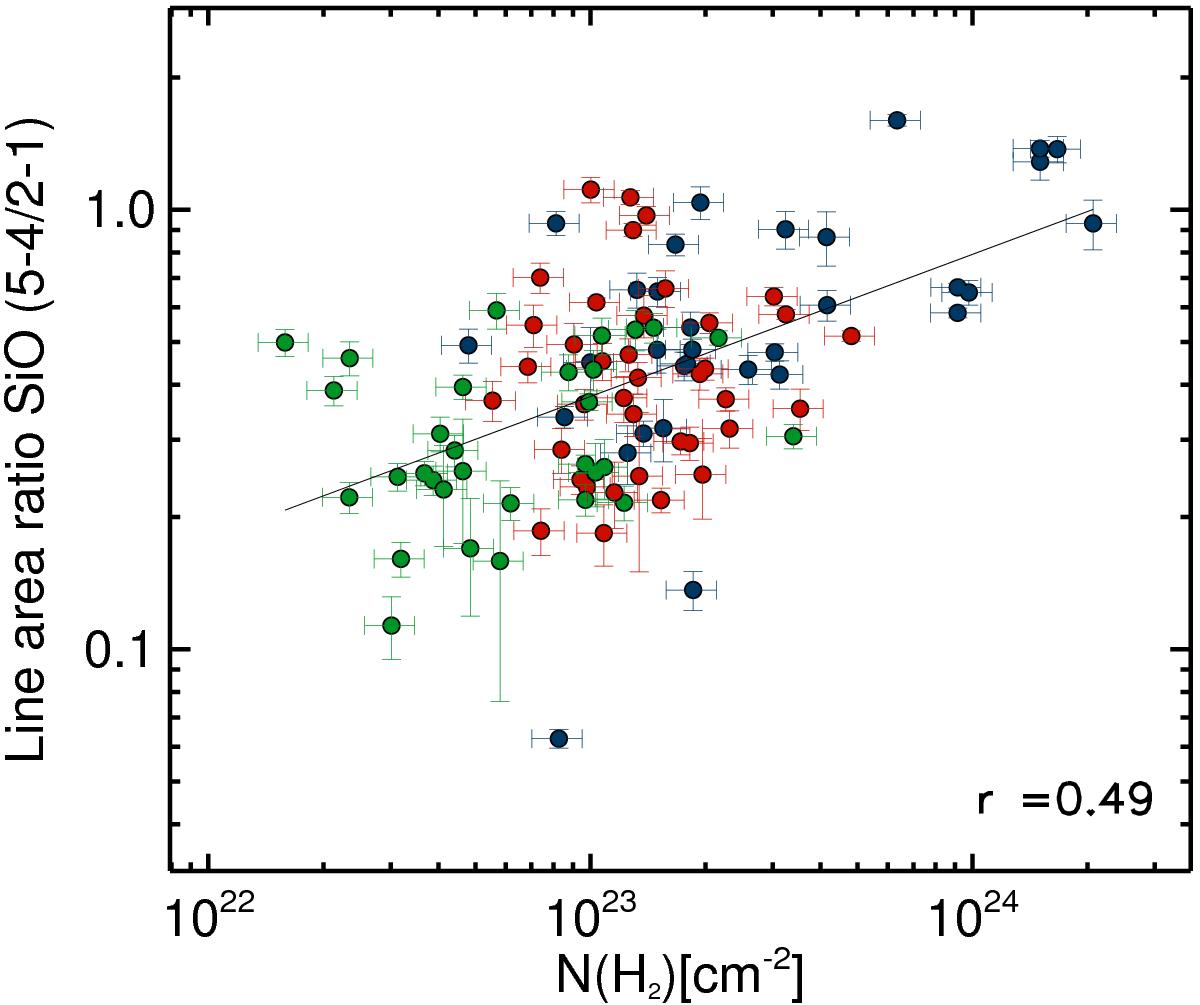
Same as Fig. 16 for the SiO (J = 5−4)/(2−1) ratio. The error is estimated to be 15% for N(H2), while for the line ratio the error is calculated from the noise in the two lines: ![]() . Altogether 100 sources are shown on the plot. Sources classified as clumps with embedded H II regions are shown in blue, red circles show the infrared-bright clumps, while green corresponds to the infrared-quiet clumps.
. Altogether 100 sources are shown on the plot. Sources classified as clumps with embedded H II regions are shown in blue, red circles show the infrared-bright clumps, while green corresponds to the infrared-quiet clumps.
Current usage metrics show cumulative count of Article Views (full-text article views including HTML views, PDF and ePub downloads, according to the available data) and Abstracts Views on Vision4Press platform.
Data correspond to usage on the plateform after 2015. The current usage metrics is available 48-96 hours after online publication and is updated daily on week days.
Initial download of the metrics may take a while.