Fig. 17
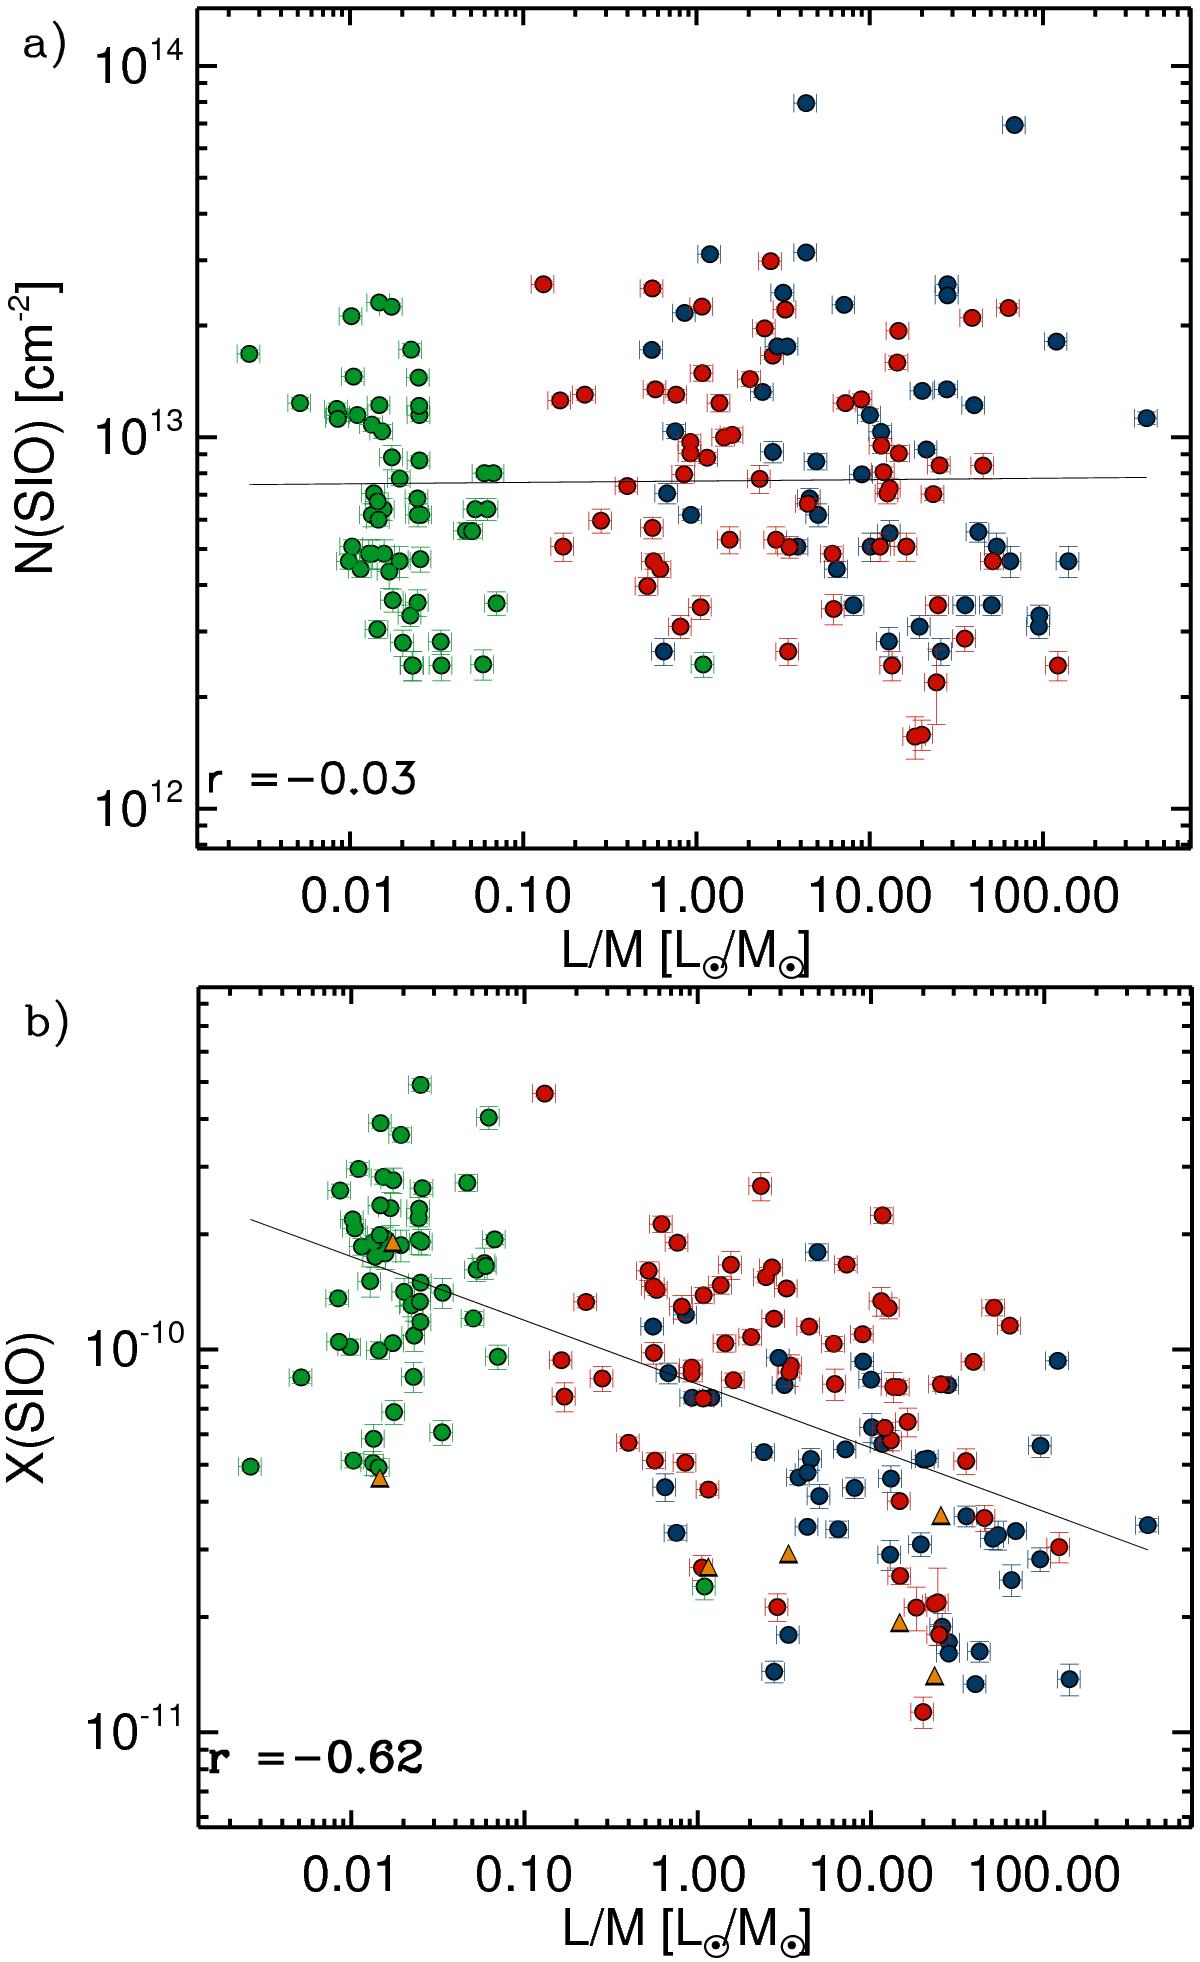
a) SiO column density estimated from the LTE assumption and the (2−1) transition versus Lbol/M. b) SiO abundance for the same sample versus Lbol/M. Triangles show abundance estimates for a few sources where the H13CO+ 1–0 line could be used as an alternative estimate for H2 column density. These points follow the same trend as the abundance estimate for the entire sample based on dust.
Current usage metrics show cumulative count of Article Views (full-text article views including HTML views, PDF and ePub downloads, according to the available data) and Abstracts Views on Vision4Press platform.
Data correspond to usage on the plateform after 2015. The current usage metrics is available 48-96 hours after online publication and is updated daily on week days.
Initial download of the metrics may take a while.