Fig. 16
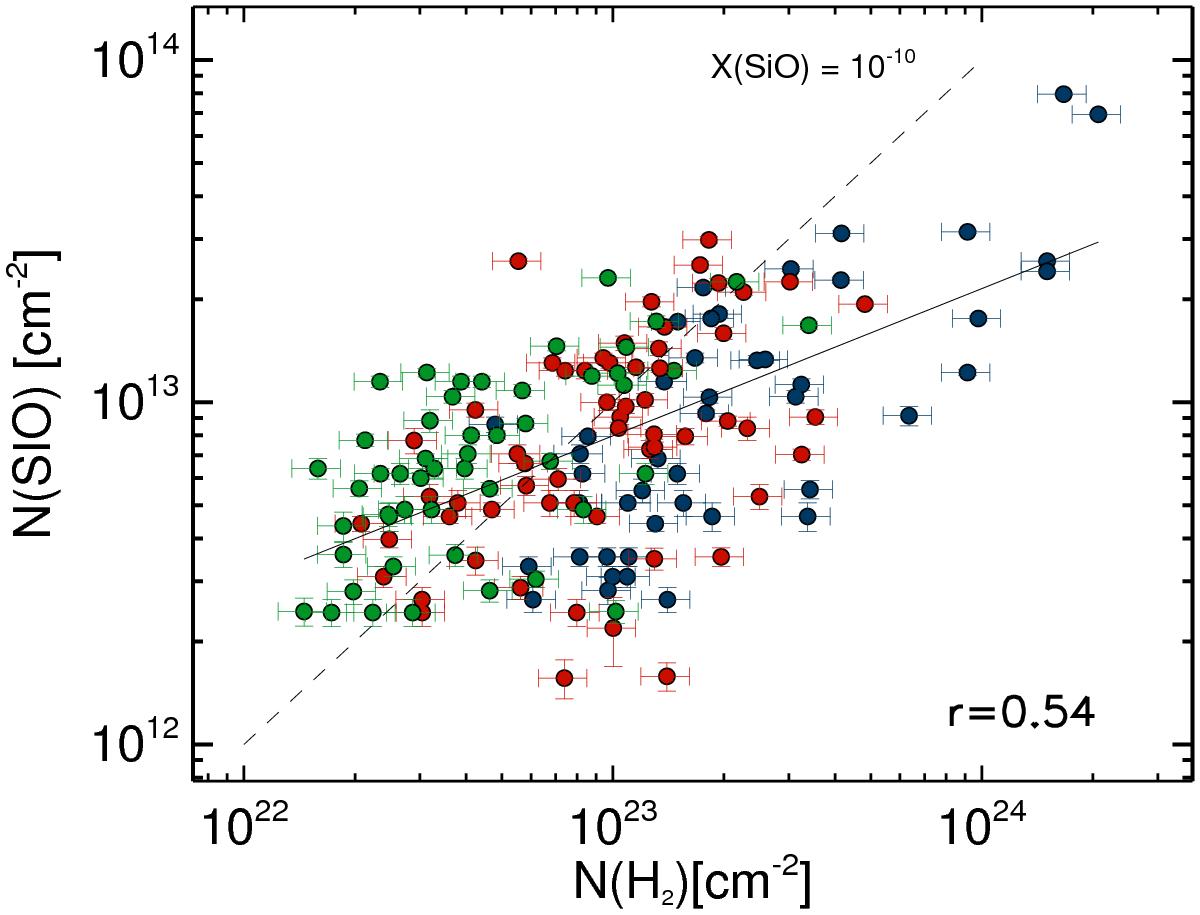
Column density of SiO estimated from the (2–1) transition for sources with >10σ detection versus column density derived from the 870 μm integrated flux density from Csengeri et al. (2014). The Spearman rank correlation coefficient, r, is shown on the panel. In total 155 sources are shown. Sources classified as clumps with embedded H II regions are shown in blue, red circles show the infrared-bright clumps, while green corresponds to the infrared-quiet clumps. The black line shows a linear fit to the data in log-log space. Dashed line corresponds to an SiO abundance of 10-10.
Current usage metrics show cumulative count of Article Views (full-text article views including HTML views, PDF and ePub downloads, according to the available data) and Abstracts Views on Vision4Press platform.
Data correspond to usage on the plateform after 2015. The current usage metrics is available 48-96 hours after online publication and is updated daily on week days.
Initial download of the metrics may take a while.