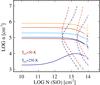
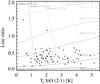
Fig. 15
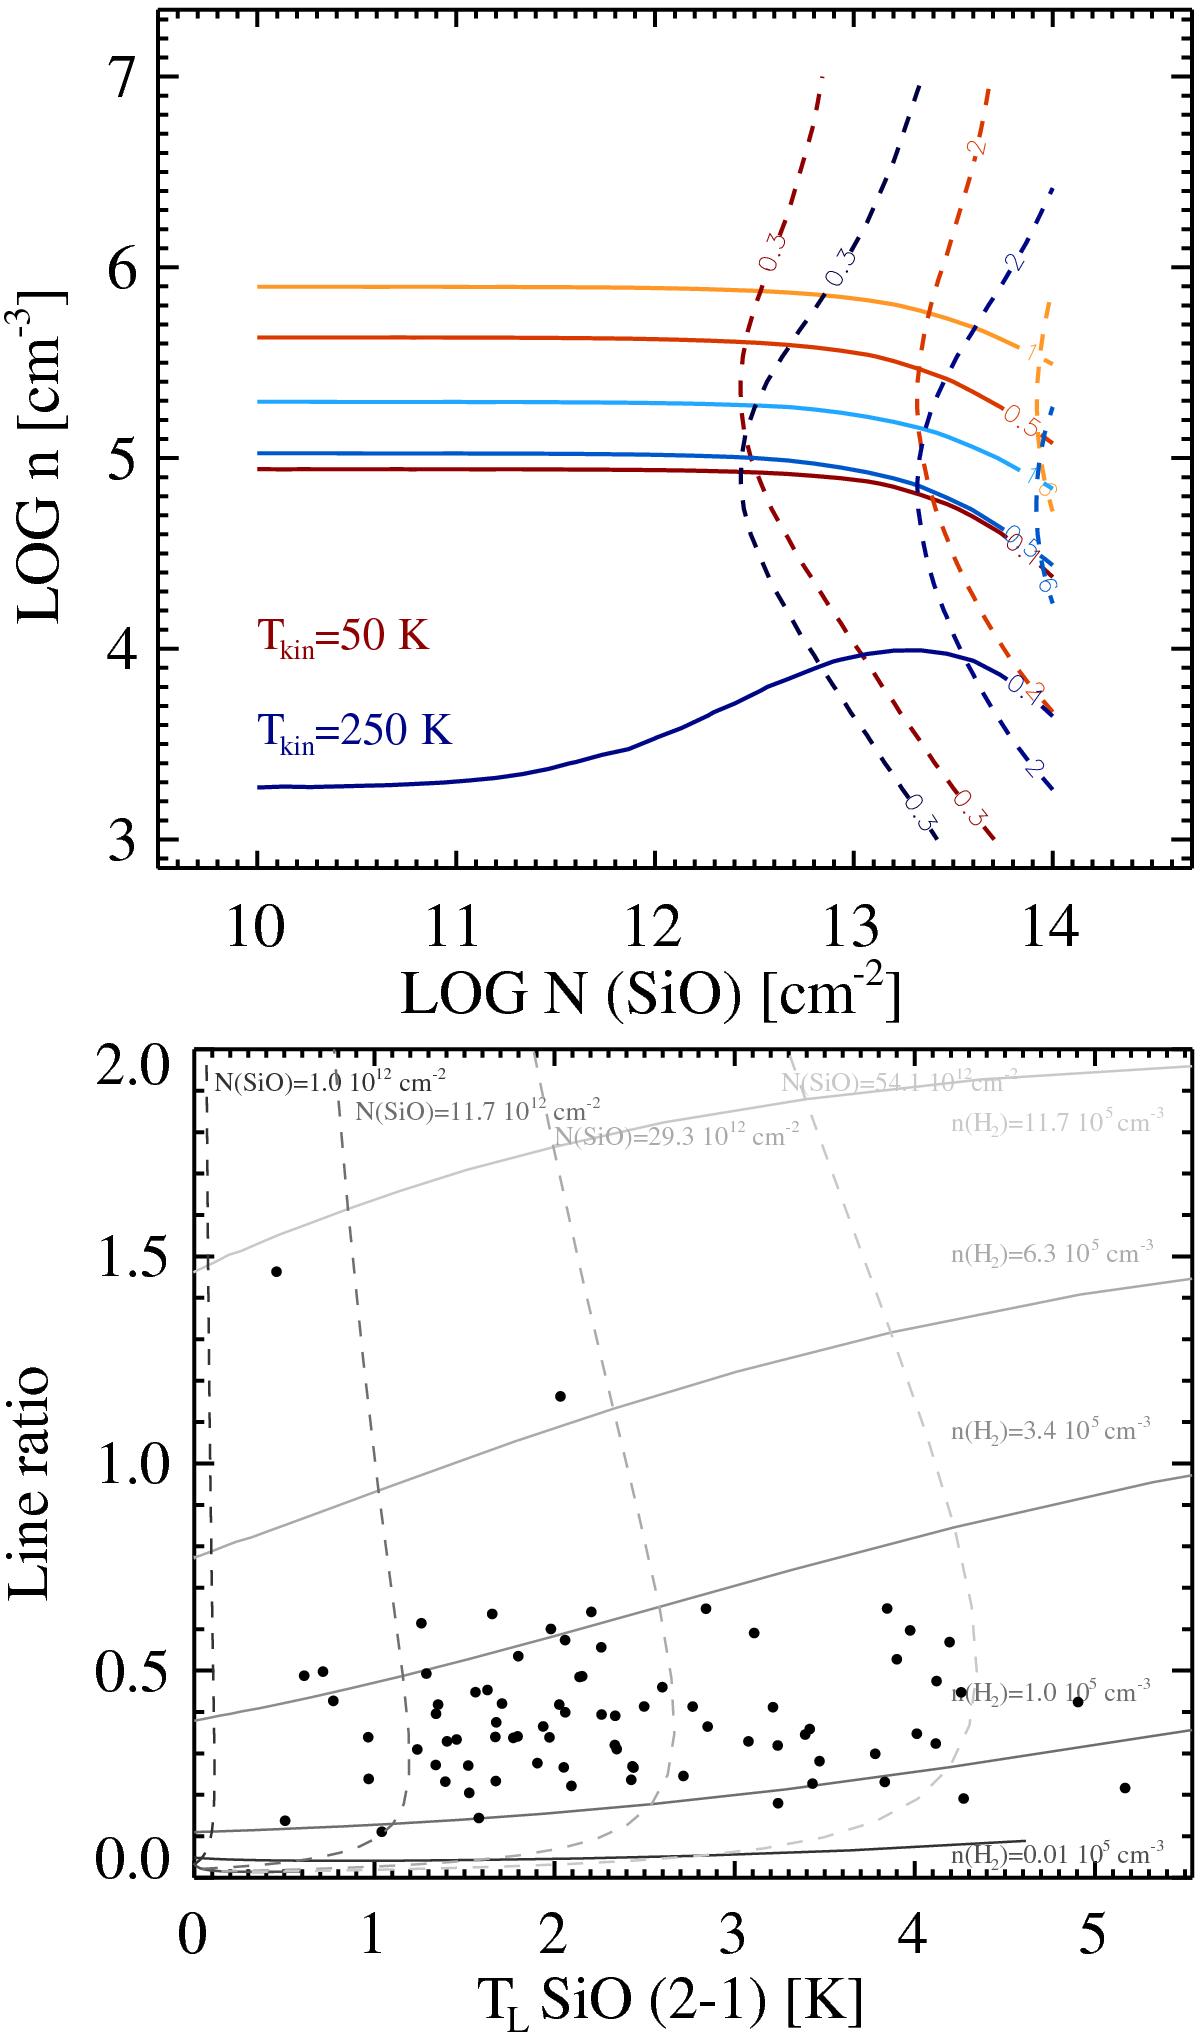
Top: non-LTE calculations with RADEX of the (5−4) to (2−1) line ratios for the typical conditions for n(H2) and N(SiO) in massive clumps. Solid lines show the estimated line ratios for Tkin = 50 K, and 250 K in varying shades corresponding to different line area ratios, which are comparable to the observed values. Dashed lines show the estimated line temperatures for the (2–1) transition with a beam filling factor of unity. Bottom: the same calculations as above for the Tkin = 50 K compared with the observed line temperatures for the (2–1) transition and the line ratio, where both values are normalised to a line width of 5 km s-1. Solid lines show the solutions for the given values of H2 density; dashed lines show the solutions for fixed SiO column density.
Current usage metrics show cumulative count of Article Views (full-text article views including HTML views, PDF and ePub downloads, according to the available data) and Abstracts Views on Vision4Press platform.
Data correspond to usage on the plateform after 2015. The current usage metrics is available 48-96 hours after online publication and is updated daily on week days.
Initial download of the metrics may take a while.