Free Access
Fig. 12
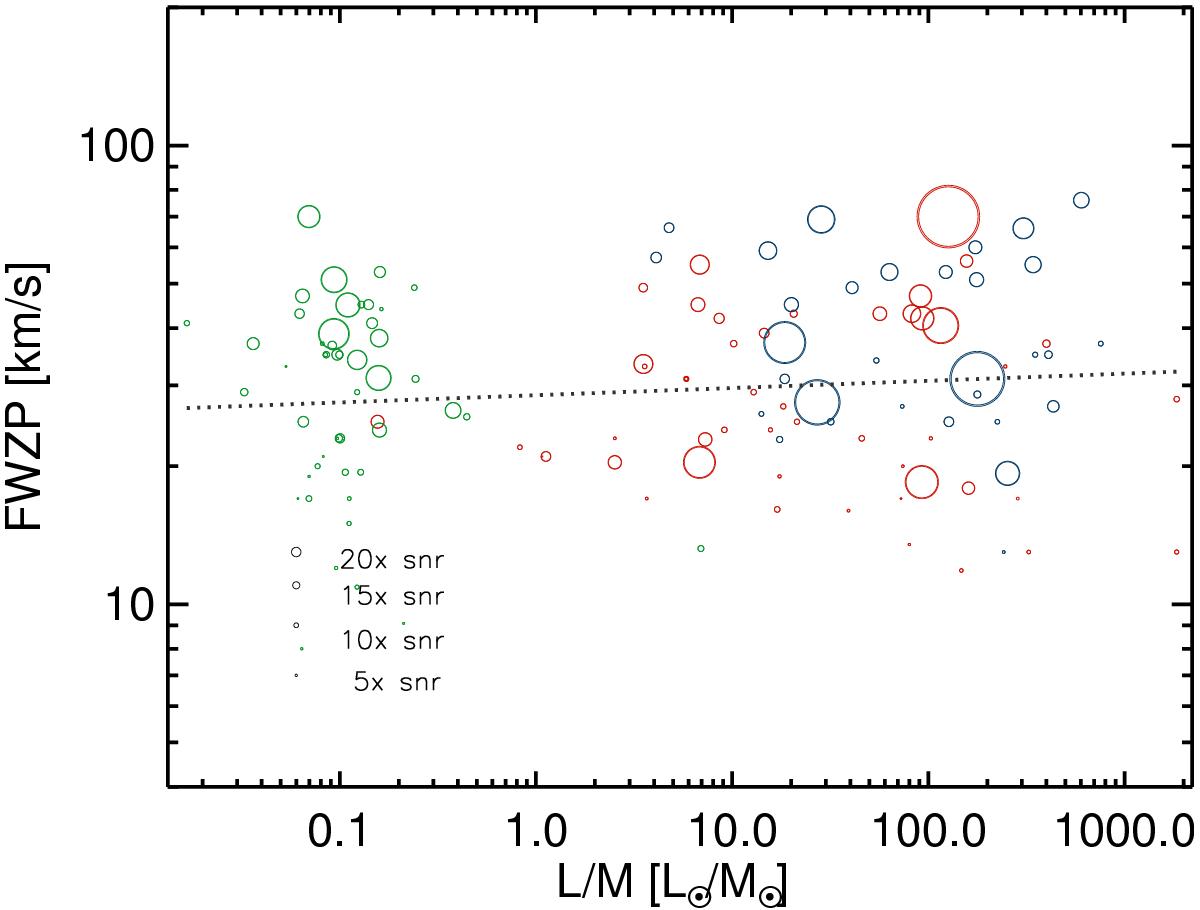
FWZP of SiO (2–1) emission for the most massive nearby (1 <d< 7 kpc) and massive (M> 650M⊙) clumps. Dotted line shows a robust linear fit to the data points, which results in a nearly constant relationship (f(x) = 1.5−0.01x) between the Lbol/M and FWZP quantities. The colours are indicated in the legend.
Current usage metrics show cumulative count of Article Views (full-text article views including HTML views, PDF and ePub downloads, according to the available data) and Abstracts Views on Vision4Press platform.
Data correspond to usage on the plateform after 2015. The current usage metrics is available 48-96 hours after online publication and is updated daily on week days.
Initial download of the metrics may take a while.