Fig. 11
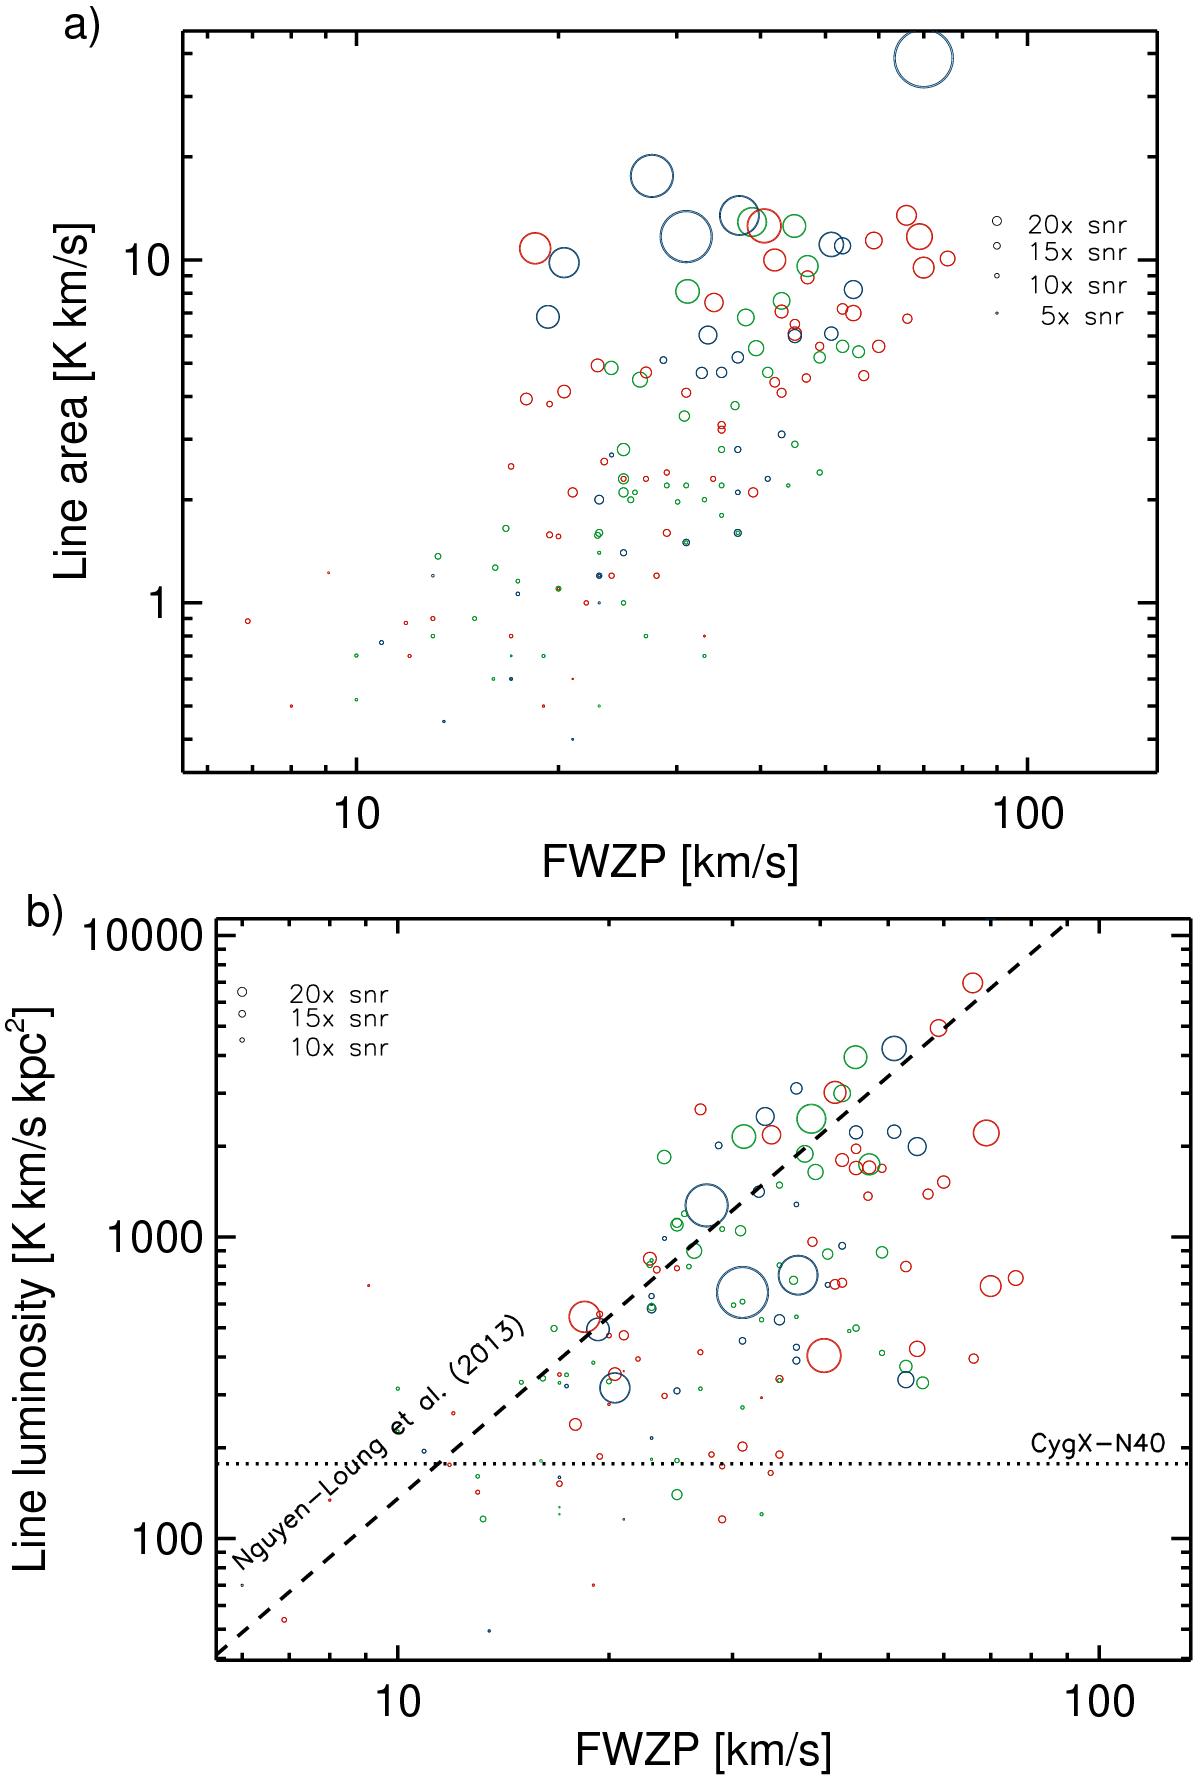
a) Integrated line area as a function of the FWZPfor the distance- and mass-limited subsample. The size of the open circles show the signal-to-noise of the line area. Blue circles show the clumps associated with H II regions, red are associated with (M)YSOs, and green corresponds to the infrared-quiet clumps. b) Line luminosity. The dashed line shows the LSiO(2−1) = αL × FWZPSiO(2−1)−βL relation, where Nguyen-Luong et al. (2013) determine αL = 144, βL = 751 for the sample of objects in the W43 Main complex. The SiO (2–1) line luminosity of the CygX-N40 MDC from Duarte-Cabral et al. (2014) is shown in dotted line.
Current usage metrics show cumulative count of Article Views (full-text article views including HTML views, PDF and ePub downloads, according to the available data) and Abstracts Views on Vision4Press platform.
Data correspond to usage on the plateform after 2015. The current usage metrics is available 48-96 hours after online publication and is updated daily on week days.
Initial download of the metrics may take a while.