Fig. 9
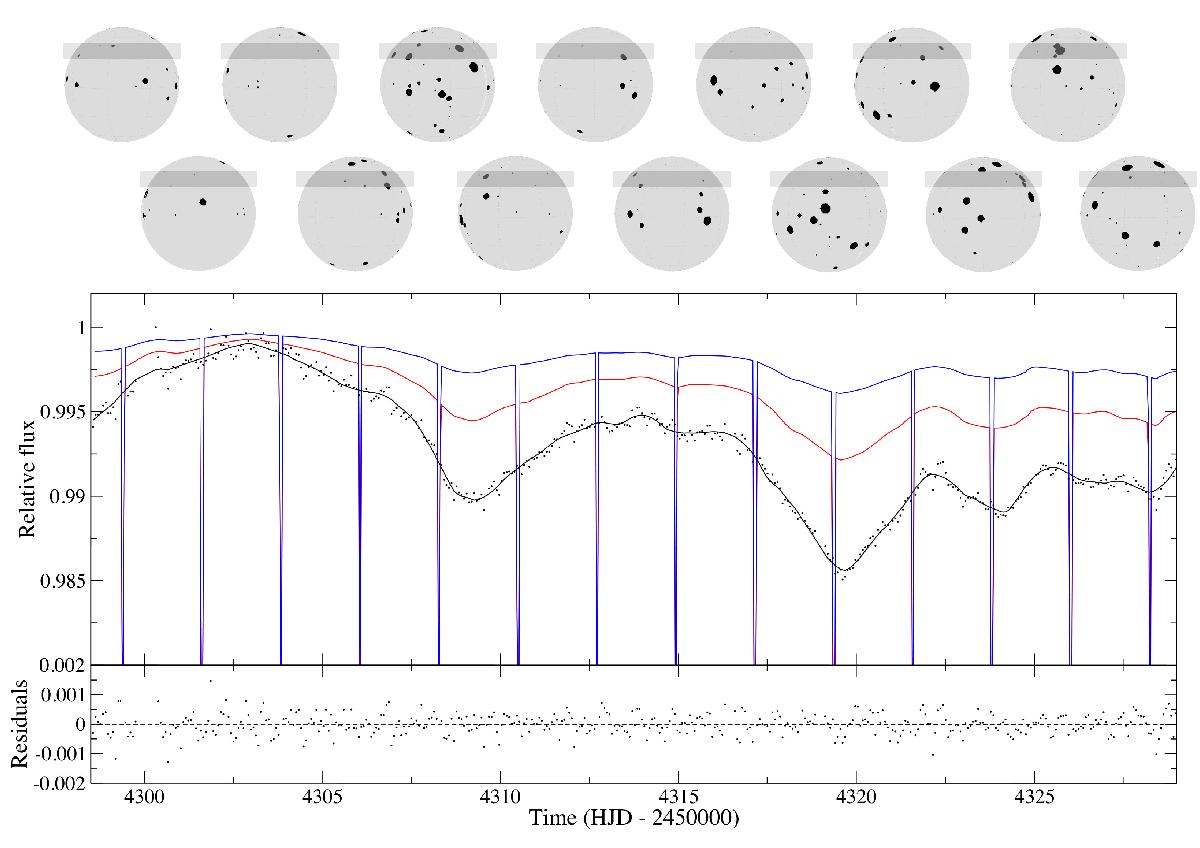
Synthetic light curves generated for HD 189733 with the method described in Sect. 2.2.2, assuming the parameters described in Sect. 5.1 and the modelled activity map for the MOST (black line), 2 MASS J (red line), and IRAC 2 (blue line) passbands. The flux is in relative units with respect to the maximum along the light curve and shows the 14 analysed transit events. Observed data from MOST are plotted with black dots. The projected maps of the stellar surface at the mid-transit times are plotted in the upper part, including a dark grey band that indicates the region of the star occulted by the planet.
Current usage metrics show cumulative count of Article Views (full-text article views including HTML views, PDF and ePub downloads, according to the available data) and Abstracts Views on Vision4Press platform.
Data correspond to usage on the plateform after 2015. The current usage metrics is available 48-96 hours after online publication and is updated daily on week days.
Initial download of the metrics may take a while.