Fig. 5
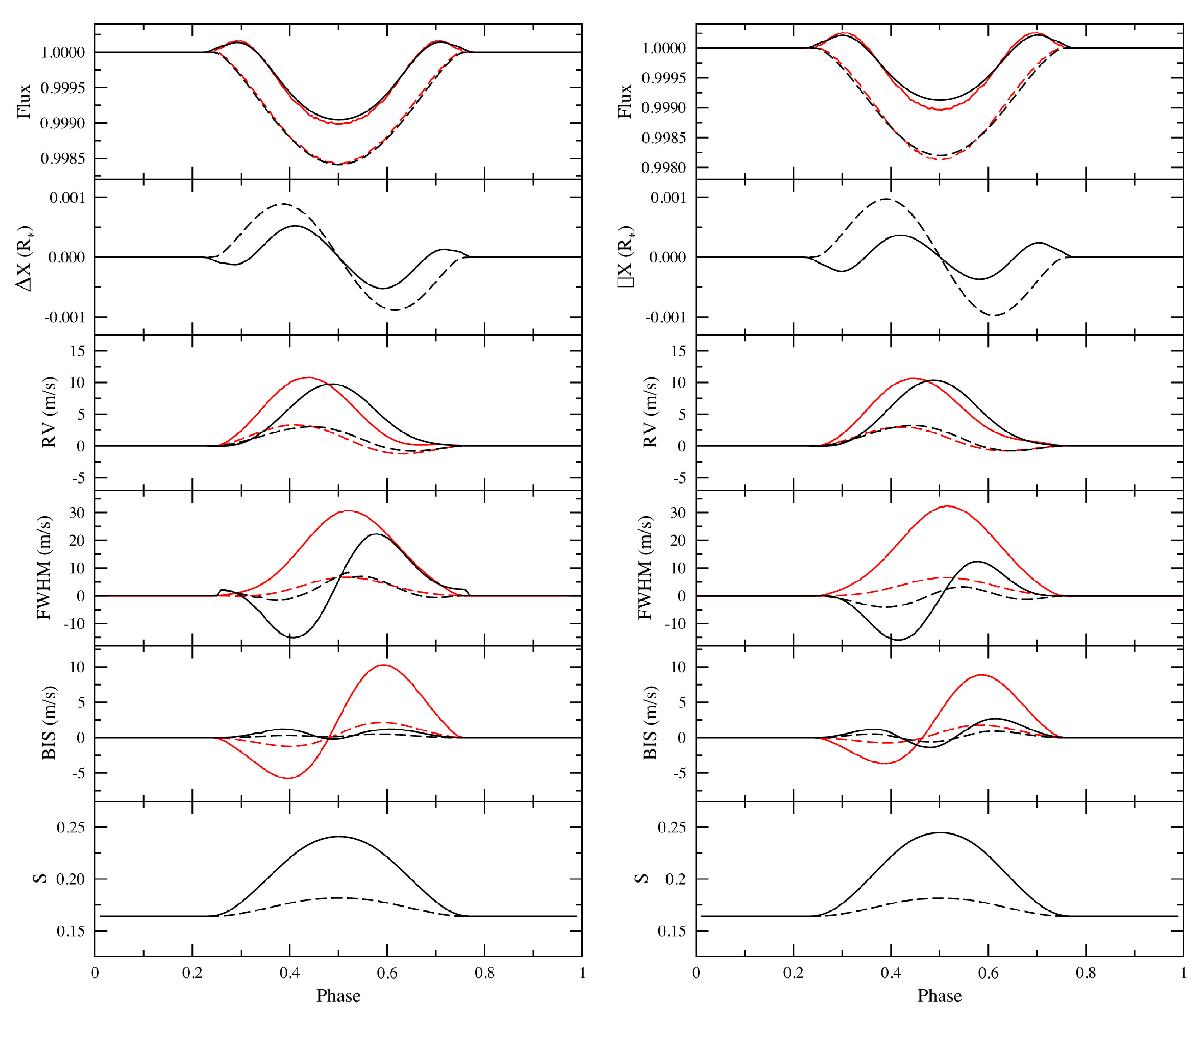
Simulations of an active region located on the equator θ = 90° with a size of ASn = 1.6 × 10⁻³ relative to the stellar surface. The rotation period is 25 days and the inclination is 90°, yielding vsini = 2 km s-1. Left panels: simulated data for a Sun-like star (Teff = 5770 K) and ΔTspot = 310 K. Right panels: the same for a K0 star (Teff = 5000 K) and ΔTspot = 250 K. From top to bottom: photometric (in Johnson V-band), astrometric, RV, FWHM, BIS, and S index variations induced by the active region. The results with surrounding faculae (Q = 3) are shown with black solid lines and those without faculae (Q = 0) are plotted with black dashed lines. The same simulations made with SOAP 2.0 are plotted with red lines.
Current usage metrics show cumulative count of Article Views (full-text article views including HTML views, PDF and ePub downloads, according to the available data) and Abstracts Views on Vision4Press platform.
Data correspond to usage on the plateform after 2015. The current usage metrics is available 48-96 hours after online publication and is updated daily on week days.
Initial download of the metrics may take a while.