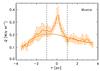
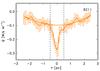
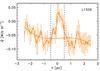
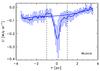
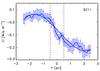
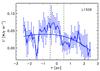
Fig. 9
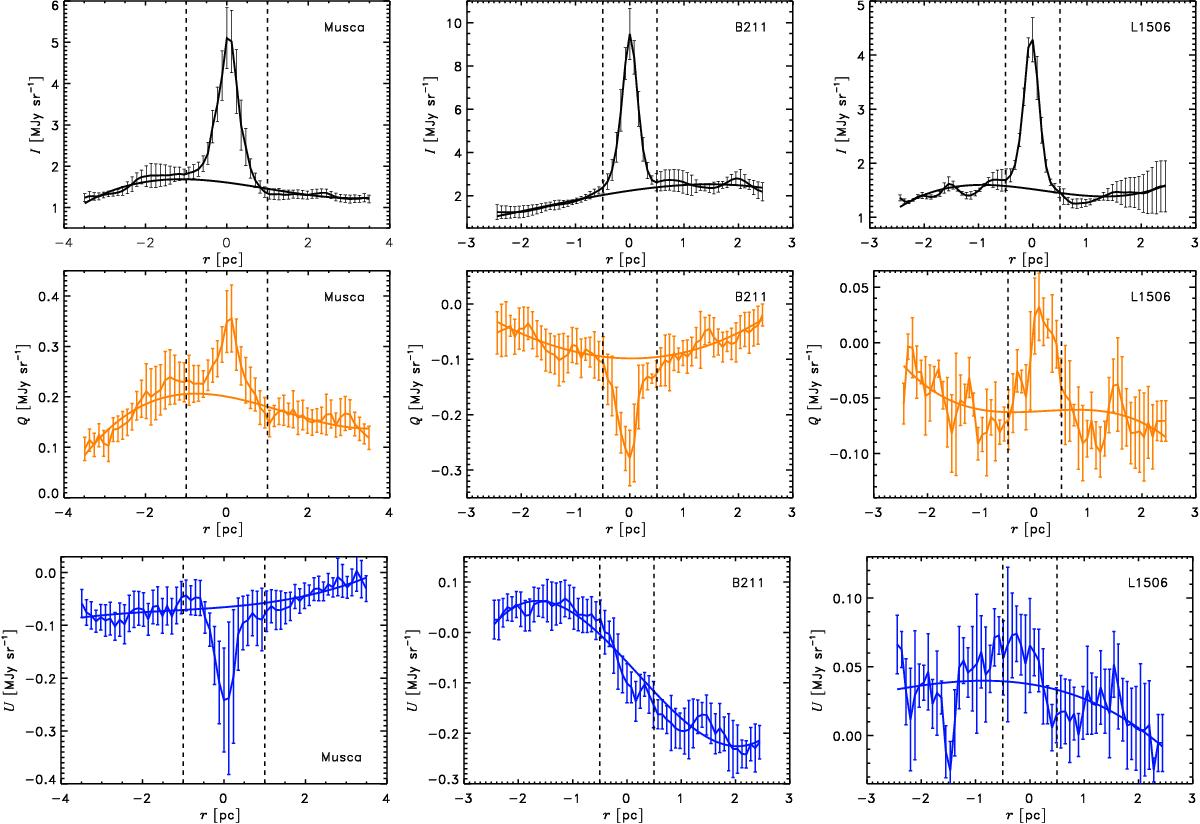
Stokes parameters observed towards Musca (left), B211(middle), and L1506 (right). The profiles correspond to the observed I (top), Q (middle) and U (bottom) emission averaged along the filament crest as explained in Sect. 4.1. The errorbars represent the dispersion of the pixel values that have been averaged at a given r. The polynomial fits to the background are also shown. The vertical dashed lines indicate the position of the outer radius Rout for each filament.
Current usage metrics show cumulative count of Article Views (full-text article views including HTML views, PDF and ePub downloads, according to the available data) and Abstracts Views on Vision4Press platform.
Data correspond to usage on the plateform after 2015. The current usage metrics is available 48-96 hours after online publication and is updated daily on week days.
Initial download of the metrics may take a while.