Fig. 8
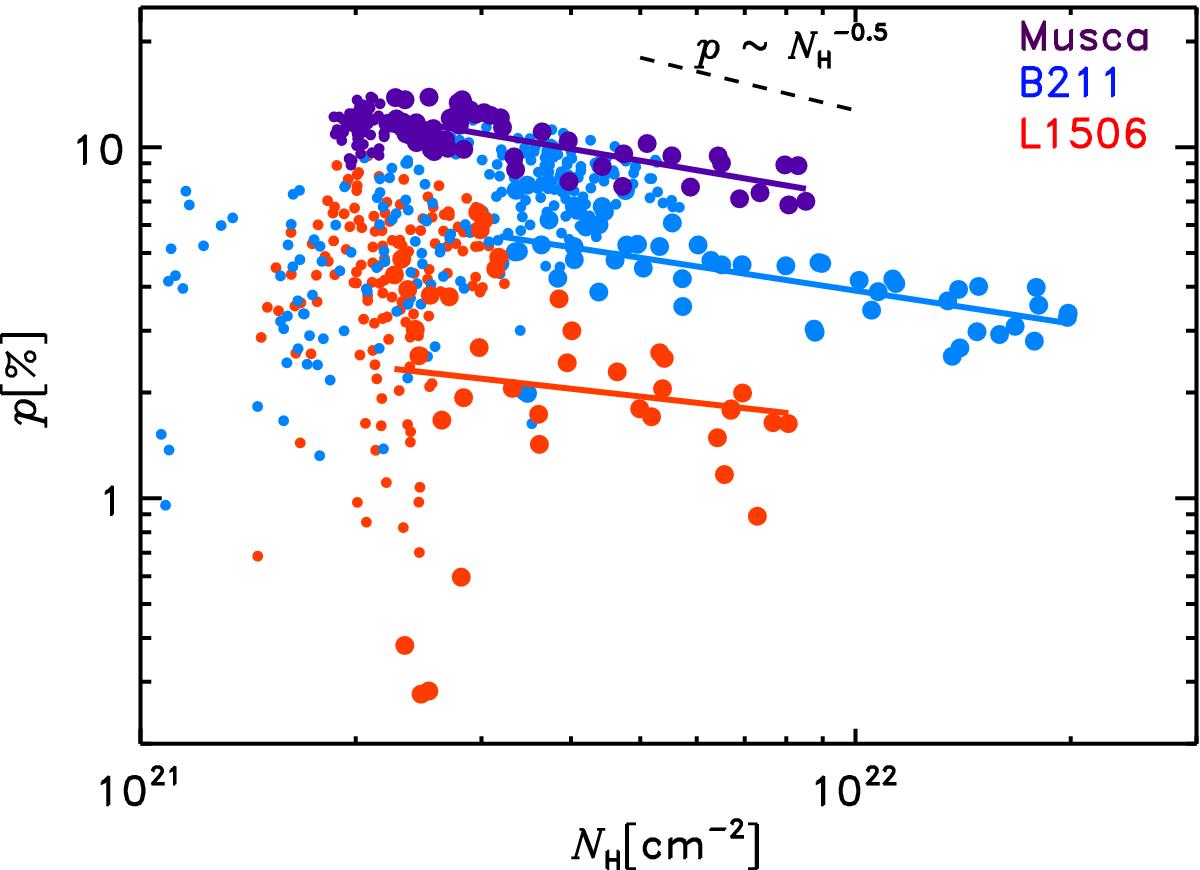
Observed polarization fraction (p) as a function of column density (NH), for the cuts across the crest of the filaments derived from the boxes shown in Fig. 7. The small and large dots correspond to the background and filament regions, respectively. The three lines show linear fits for the filament regions of log p versus log NH described in Sect. 3.4. The data uncertainties depend on the intensity of the polarized emission. They are the largest for low p and NH values. The mean errorbar on p is 1.2% for the data points used for the linear fits. For smaller NH values, the uncertainty on p is larger but does not account for the full dispersion of the data points.
Current usage metrics show cumulative count of Article Views (full-text article views including HTML views, PDF and ePub downloads, according to the available data) and Abstracts Views on Vision4Press platform.
Data correspond to usage on the plateform after 2015. The current usage metrics is available 48-96 hours after online publication and is updated daily on week days.
Initial download of the metrics may take a while.