Fig. 7
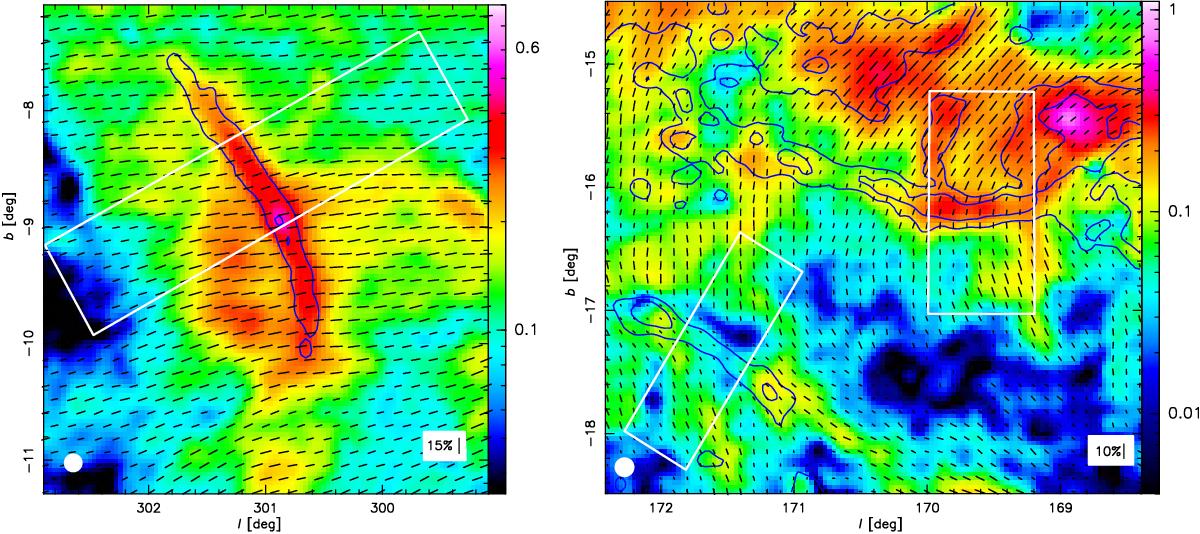
Observed polarized emission at 353 GHz (in MJy sr-1) of the Musca (left) and Taurus (right) clouds. The maps are at the resolution of 9.′6 (indicated by the white filled circles) for increased S/N. The black segments show the BPOS-field orientation (ψ+90°). The length of the pseudo-vectors is proportional to the polarization fraction. The blue contours show the total dust intensity at levels of 3 and 6 MJy sr-1, at the resolution of 4.′8. The white boxes correspond to the area of the filaments and their backgrounds that is analysed in the rest of the paper.
Current usage metrics show cumulative count of Article Views (full-text article views including HTML views, PDF and ePub downloads, according to the available data) and Abstracts Views on Vision4Press platform.
Data correspond to usage on the plateform after 2015. The current usage metrics is available 48-96 hours after online publication and is updated daily on week days.
Initial download of the metrics may take a while.