Fig. 5
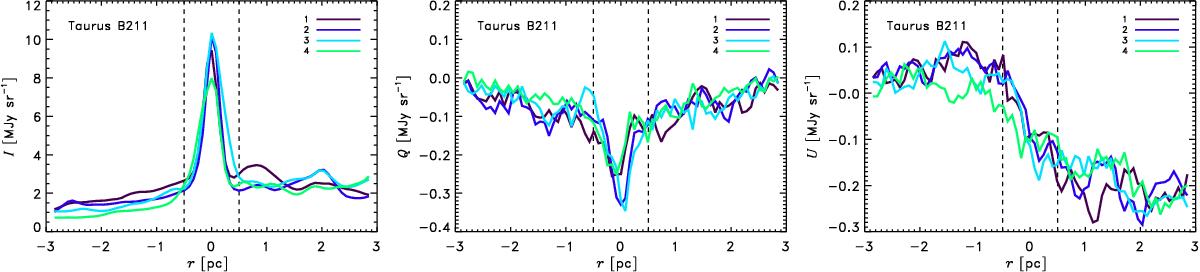
Same as Fig. 2 for the Taurus B211 filament. Here r< 0 corresponds to the southern side of the filament crest. The filament is clearly seen in Q and is located in the area of a steep variation of the U emission. The dispersion of the emission is small along the length of the filament.
Current usage metrics show cumulative count of Article Views (full-text article views including HTML views, PDF and ePub downloads, according to the available data) and Abstracts Views on Vision4Press platform.
Data correspond to usage on the plateform after 2015. The current usage metrics is available 48-96 hours after online publication and is updated daily on week days.
Initial download of the metrics may take a while.