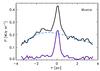
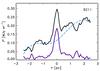
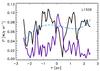
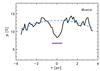
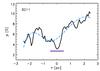
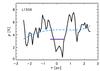
Fig. 10
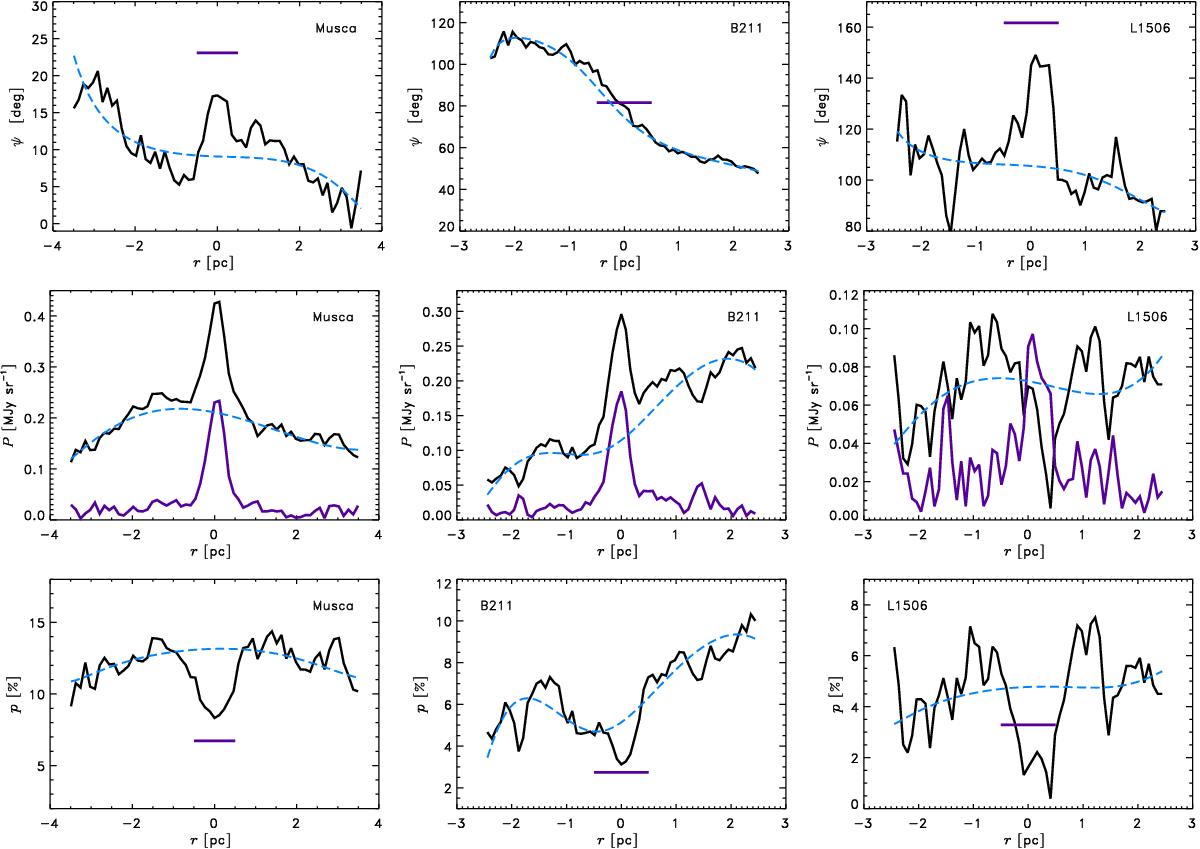
Observed profiles (in black) of the polarization angle, the polarized intensity, and the polarization fraction, from top to bottom. The dashed blue curves show the variation of the background values of ψbg, Pbg, and pbg derived from Ibg, Qbg, and Ubg. On the middle three plots, the Pfil profiles in purple are derived from the polynomial fits Ifil, Qfil, and Ufil. On the top and bottom plots, the horizontal purple lines indicate the mean values of the intrinsic polarization angle and fraction of the filaments for | r | ≤ Rout.
Current usage metrics show cumulative count of Article Views (full-text article views including HTML views, PDF and ePub downloads, according to the available data) and Abstracts Views on Vision4Press platform.
Data correspond to usage on the plateform after 2015. The current usage metrics is available 48-96 hours after online publication and is updated daily on week days.
Initial download of the metrics may take a while.