Fig. 1
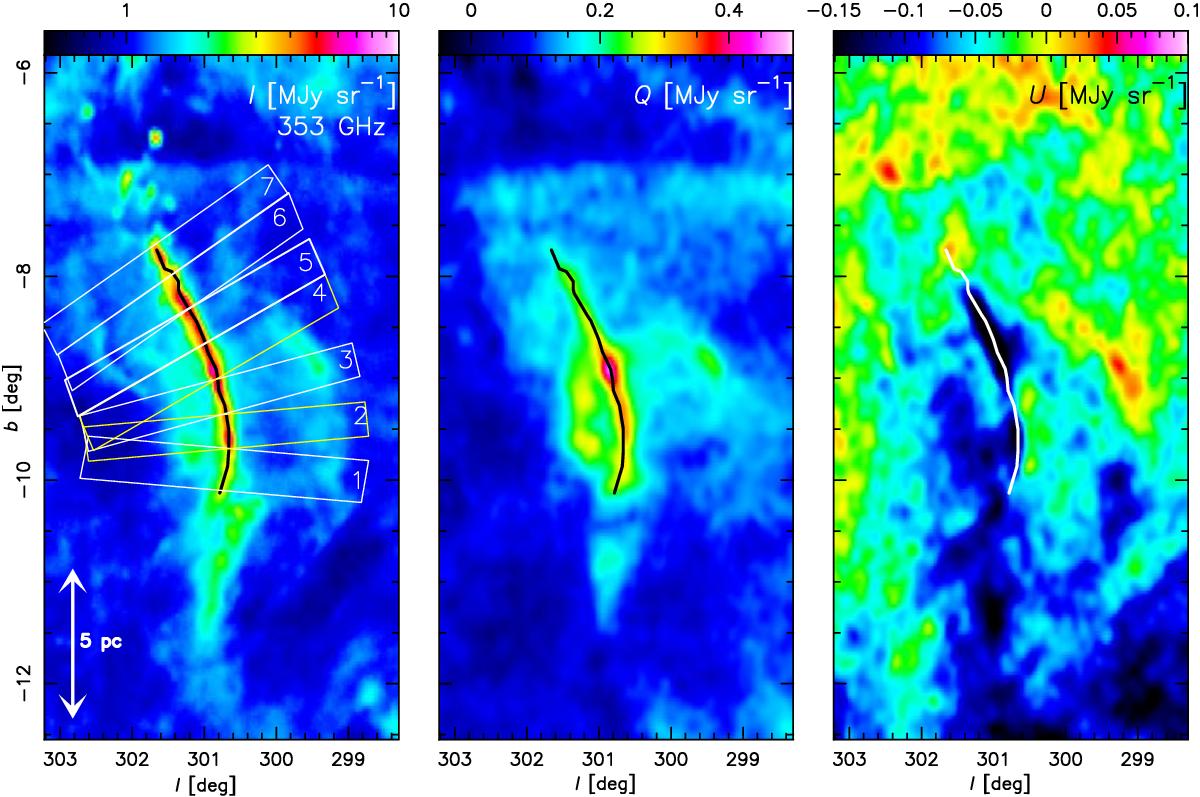
Planck 353 GHz Stokes parameter maps of Musca (in MJy sr-1). The total intensity map is at a resolution of 4.′8, while the Q and U maps are smoothed to a resolution of 9.′6 for better visualization. The crest of the filament traced on the I map is drawn in black (on the I and Q maps) and white (on the U map). The boxes drawn on the I map, numbered from 1 to 7, show the regions from which the mean profiles are derived (see Fig. 2).
Current usage metrics show cumulative count of Article Views (full-text article views including HTML views, PDF and ePub downloads, according to the available data) and Abstracts Views on Vision4Press platform.
Data correspond to usage on the plateform after 2015. The current usage metrics is available 48-96 hours after online publication and is updated daily on week days.
Initial download of the metrics may take a while.