Fig. 9
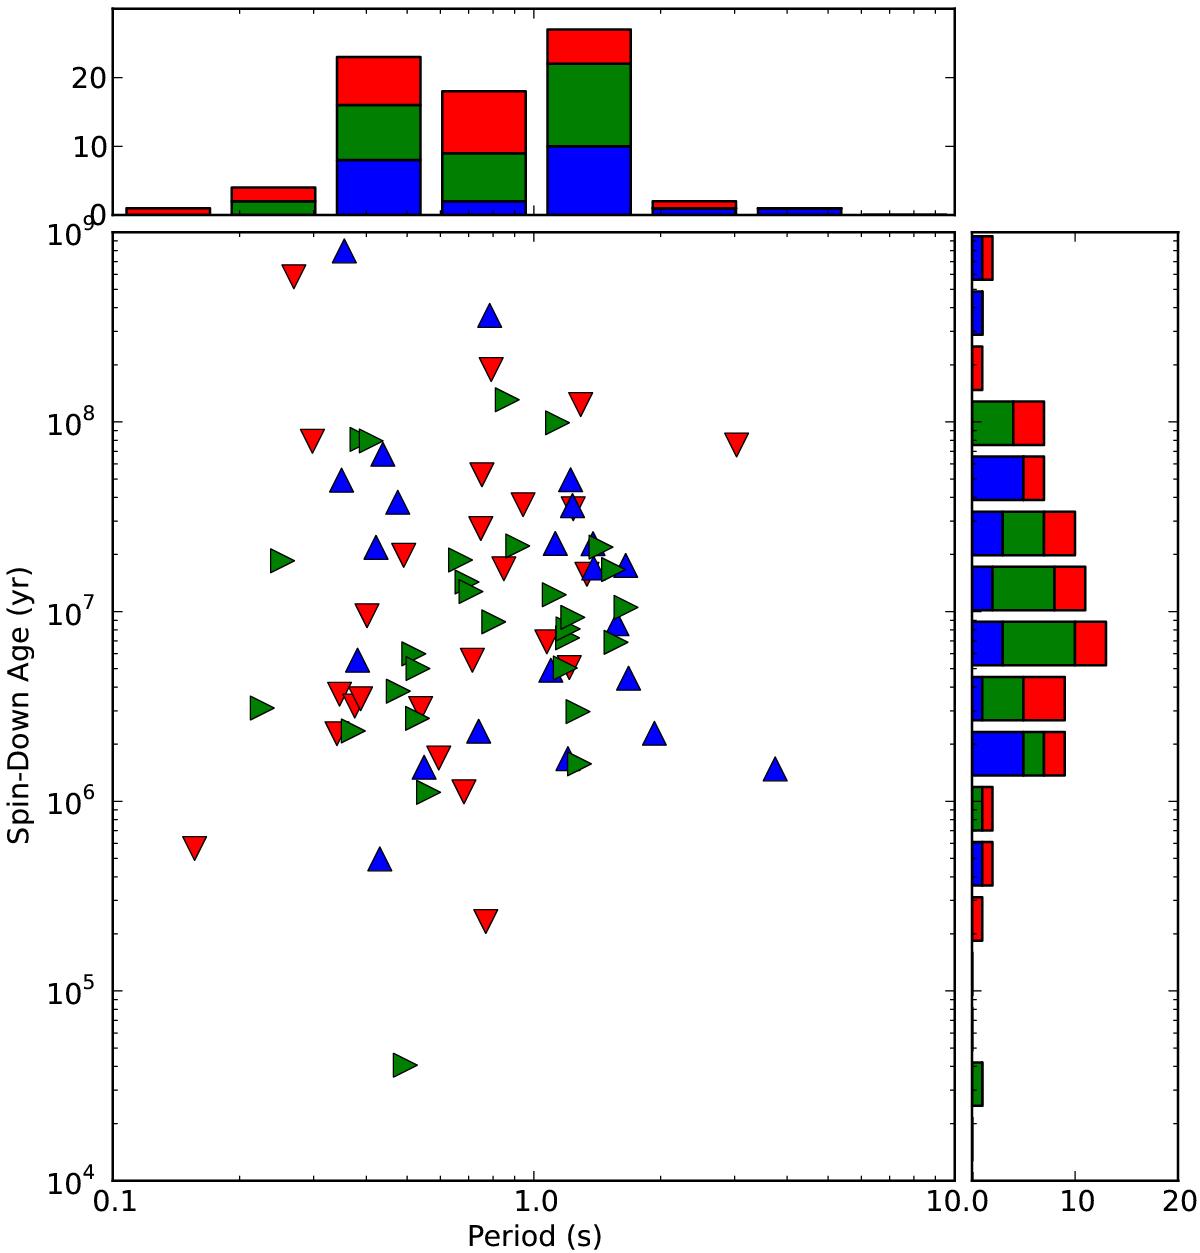
Spin-down age vs period for the pulsars whose profiles are not affected by scattering in HBAs. Here the shape- and colour-coding represent the difference of the number of peaks for each pulsar between HBAs and L-band relative to the HBAs. In red (triangles down) are the pulsars for which the number of peaks becomes smaller at HBAs than it is in L-band, in blue (triangles up) are the pulsars for which the number of peaks becomes higher at HBAs than it is in L-band, and in green (triangles right) are the pulsars for which the number of peaks does not change. At the top and on the right-hand side the stacked histograms represent the trends of the number of peaks as a function of period and age of the pulsar, respectively.
Current usage metrics show cumulative count of Article Views (full-text article views including HTML views, PDF and ePub downloads, according to the available data) and Abstracts Views on Vision4Press platform.
Data correspond to usage on the plateform after 2015. The current usage metrics is available 48-96 hours after online publication and is updated daily on week days.
Initial download of the metrics may take a while.