Fig. 8
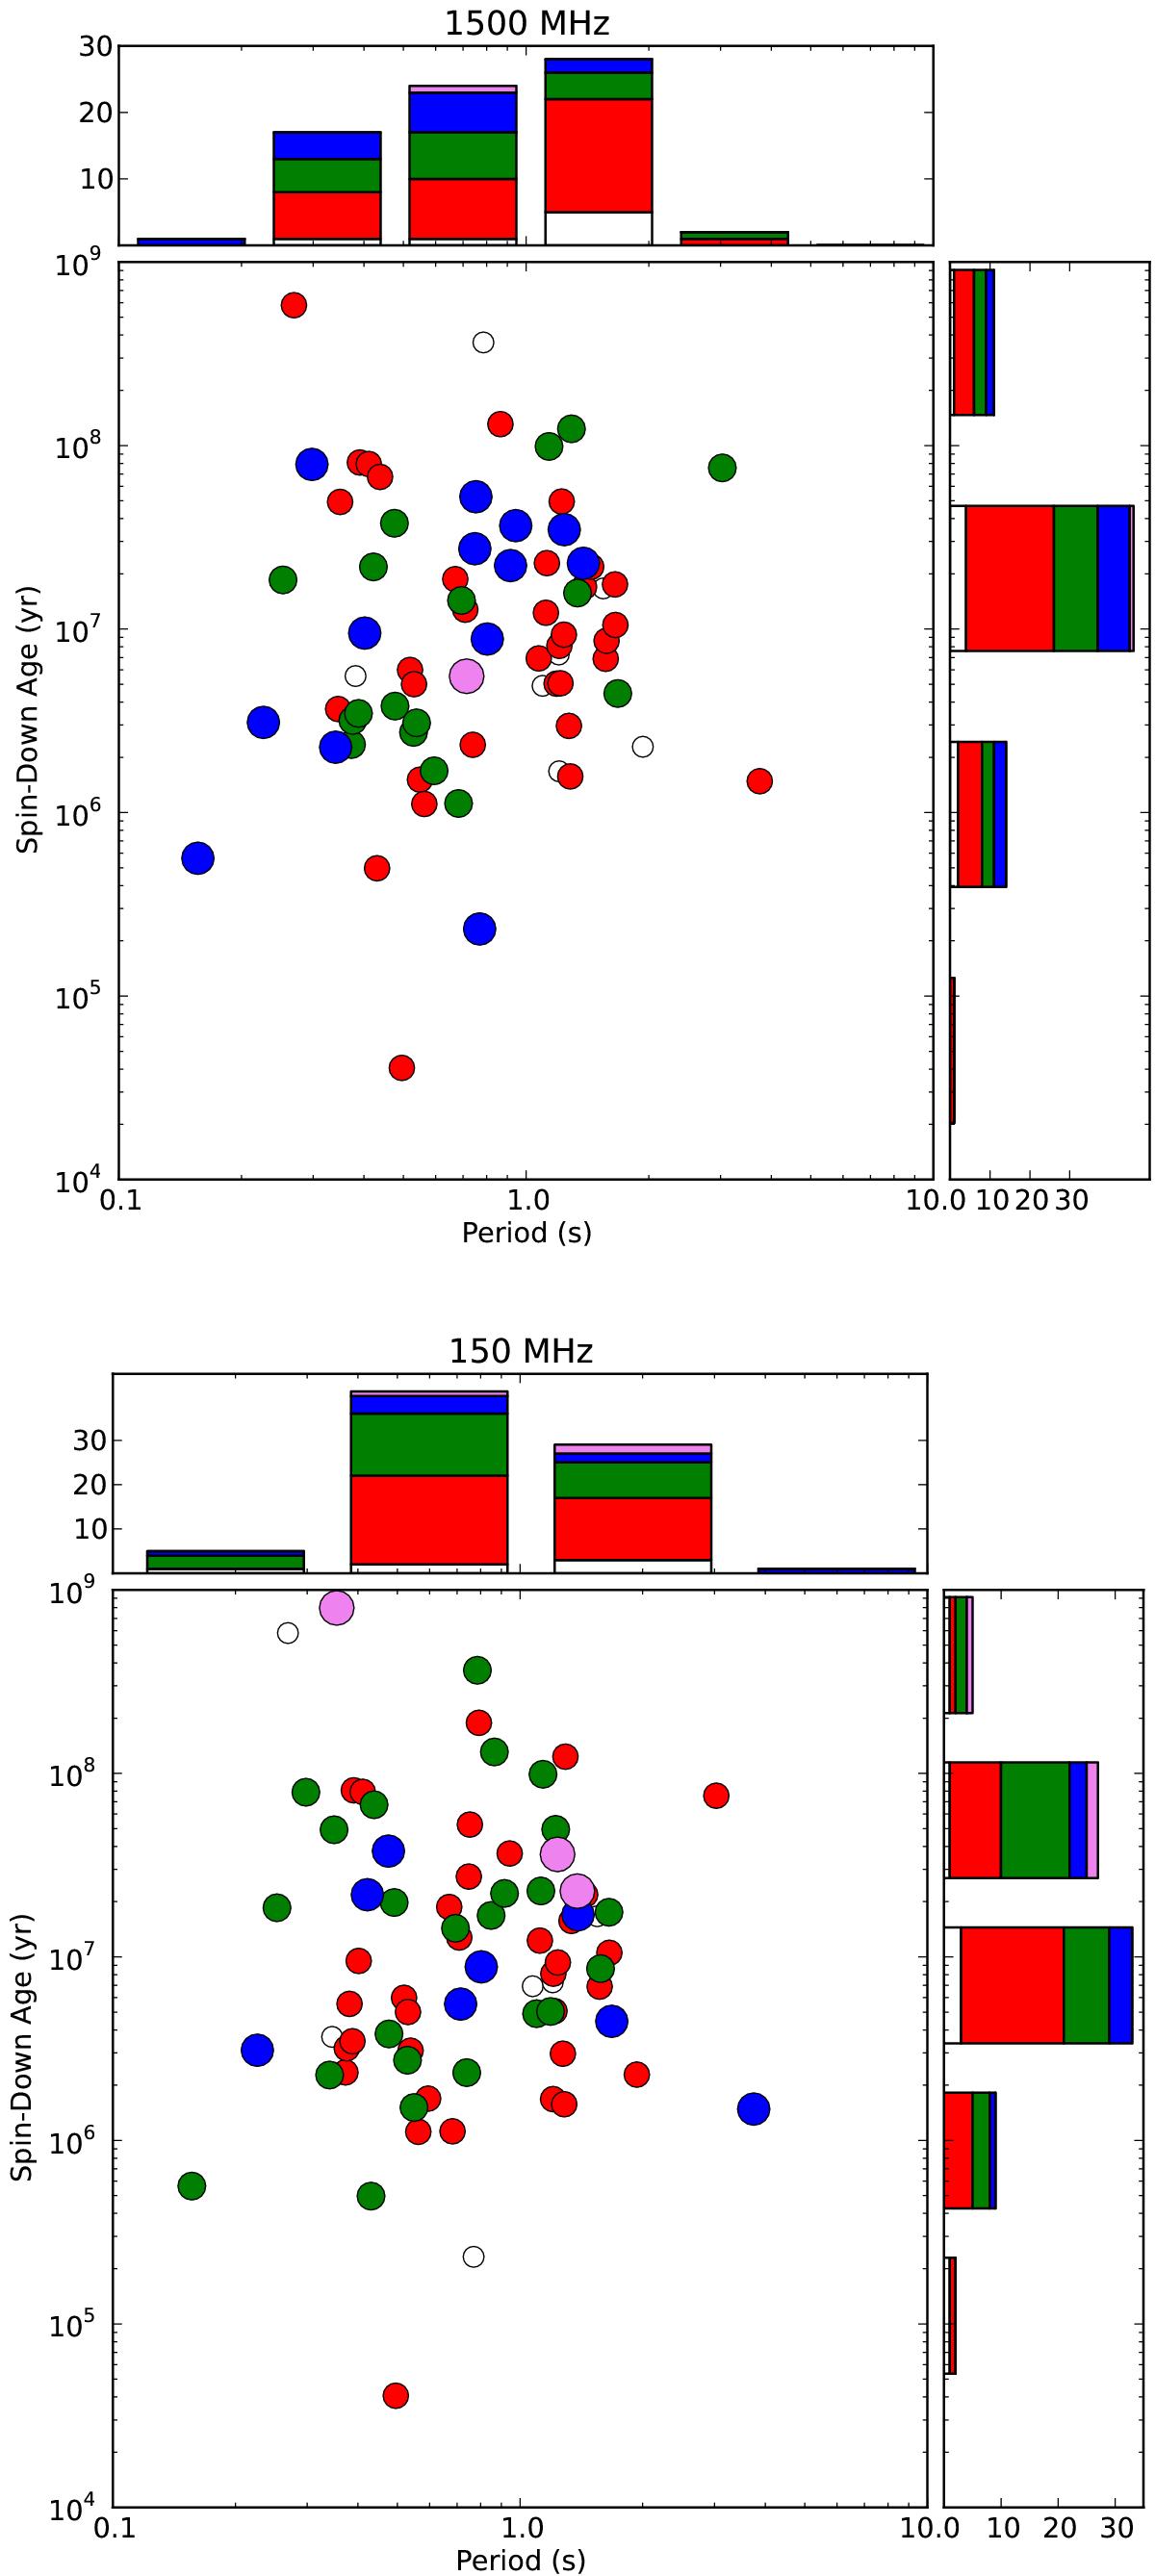
Spin-down age vs. period in HBAs and at L-band for the pulsars whose profiles are not affected by scattering in HBAs. The colour (and symbol size) code for the number of peaks is white = 1, red = 2, green = 3, blue = 4, and violet >4. The histograms at the sides represent the distribution of these values as a function of spin-down age (right-most histogram) and of period (top-most histogram). From the plots no trend is visible in the number of peaks.
Current usage metrics show cumulative count of Article Views (full-text article views including HTML views, PDF and ePub downloads, according to the available data) and Abstracts Views on Vision4Press platform.
Data correspond to usage on the plateform after 2015. The current usage metrics is available 48-96 hours after online publication and is updated daily on week days.
Initial download of the metrics may take a while.