Fig. 6
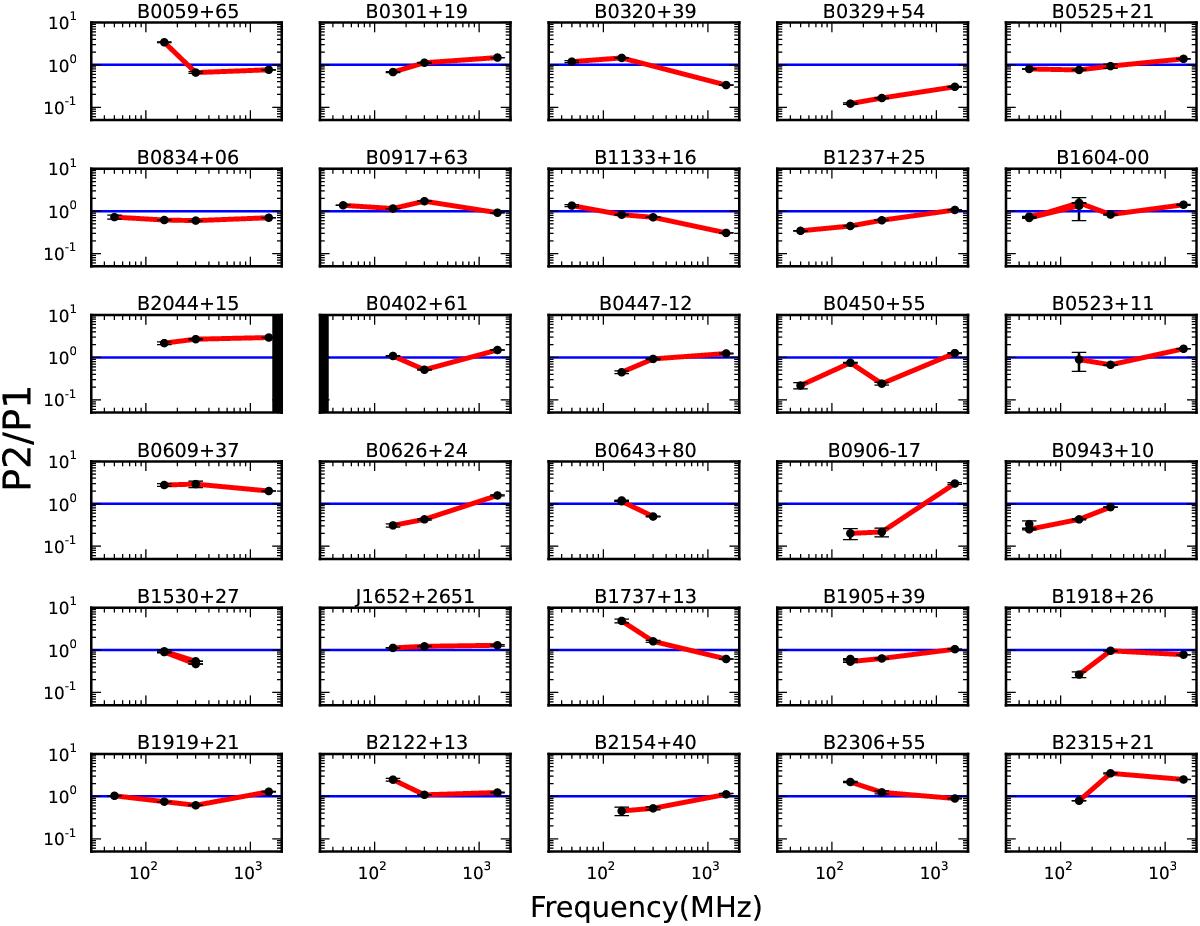
Ratio of peak amplitudes for pulsars with multiple peaks as a function of observing frequency. The red line connects the dots (it is not representative of the power law used to fit an exponential dependence: P2 / P1(ν) ∝ νγ. It is evident that in most cases a power law does not represent the best fit for the frequency evolution of the peaks’ ratio, although care should be taken as it is hard to reliably track the peak amplitudes in some cases and to follow the same P2 and P1 (see Sect. 5.1.1 for details). The blue line corresponds to the inversion point where the peaks have equal amplitude. It is evident that in a number of cases the relative amplitudes of the peaks invert as a function of frequency (see Sect. 5.1.1 for details). The black vertical lines in between plots 11 and 12 mark the change between previously studied cases and new (see text for details).
Current usage metrics show cumulative count of Article Views (full-text article views including HTML views, PDF and ePub downloads, according to the available data) and Abstracts Views on Vision4Press platform.
Data correspond to usage on the plateform after 2015. The current usage metrics is available 48-96 hours after online publication and is updated daily on week days.
Initial download of the metrics may take a while.