Fig. 4
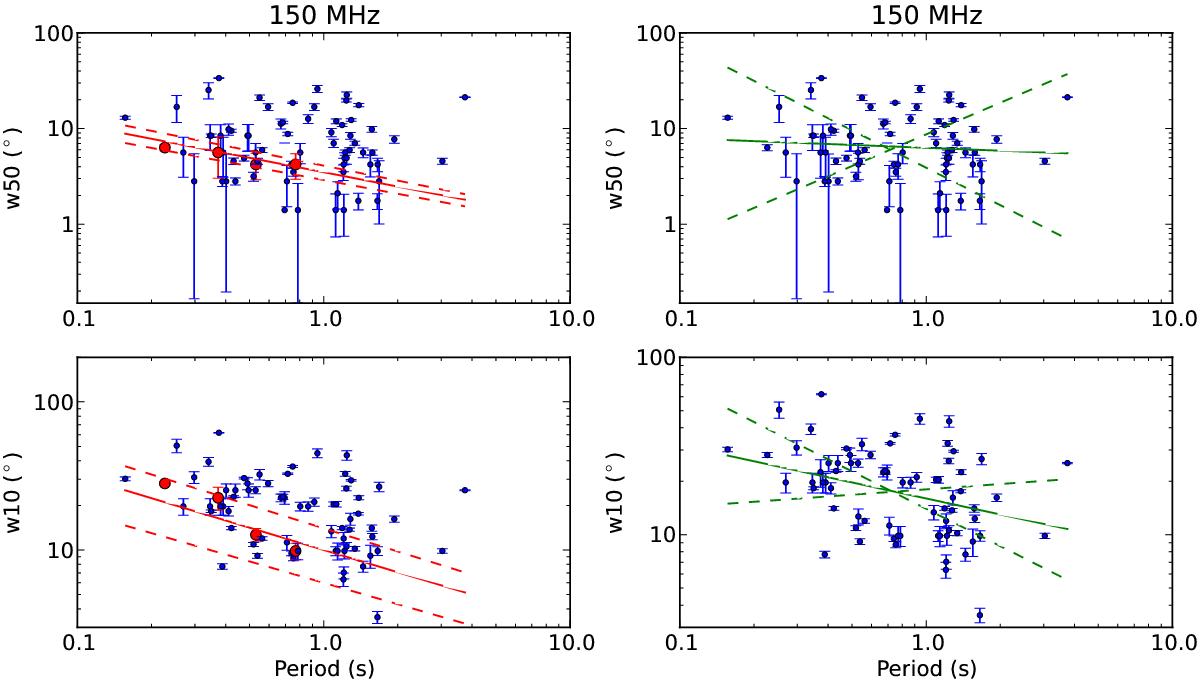
HBA profile widths w50 (top) and w10 (bottom) as a function of spin period. Left side: the blue and red dots represent the data (red: interpulse pulsars, blue: other pulsars), while the red solid line represents the best fit (non-weighted) and the red dashed lines represent its 1σ dispersion for w = A·P-0.5. The fit is calculated using our interpulse pulsars, following Rankin (1990) and Maciesiak et al. (2011) (see discussion in the text). Right side: the blue dots represent the data, while the green solid line represents the best (non-weighted) fit for all the pulsars: w = A·P− n , and the green dashed lines represent its 1σ dispersion (see discussion in the text).
Current usage metrics show cumulative count of Article Views (full-text article views including HTML views, PDF and ePub downloads, according to the available data) and Abstracts Views on Vision4Press platform.
Data correspond to usage on the plateform after 2015. The current usage metrics is available 48-96 hours after online publication and is updated daily on week days.
Initial download of the metrics may take a while.