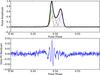
Fig. 2
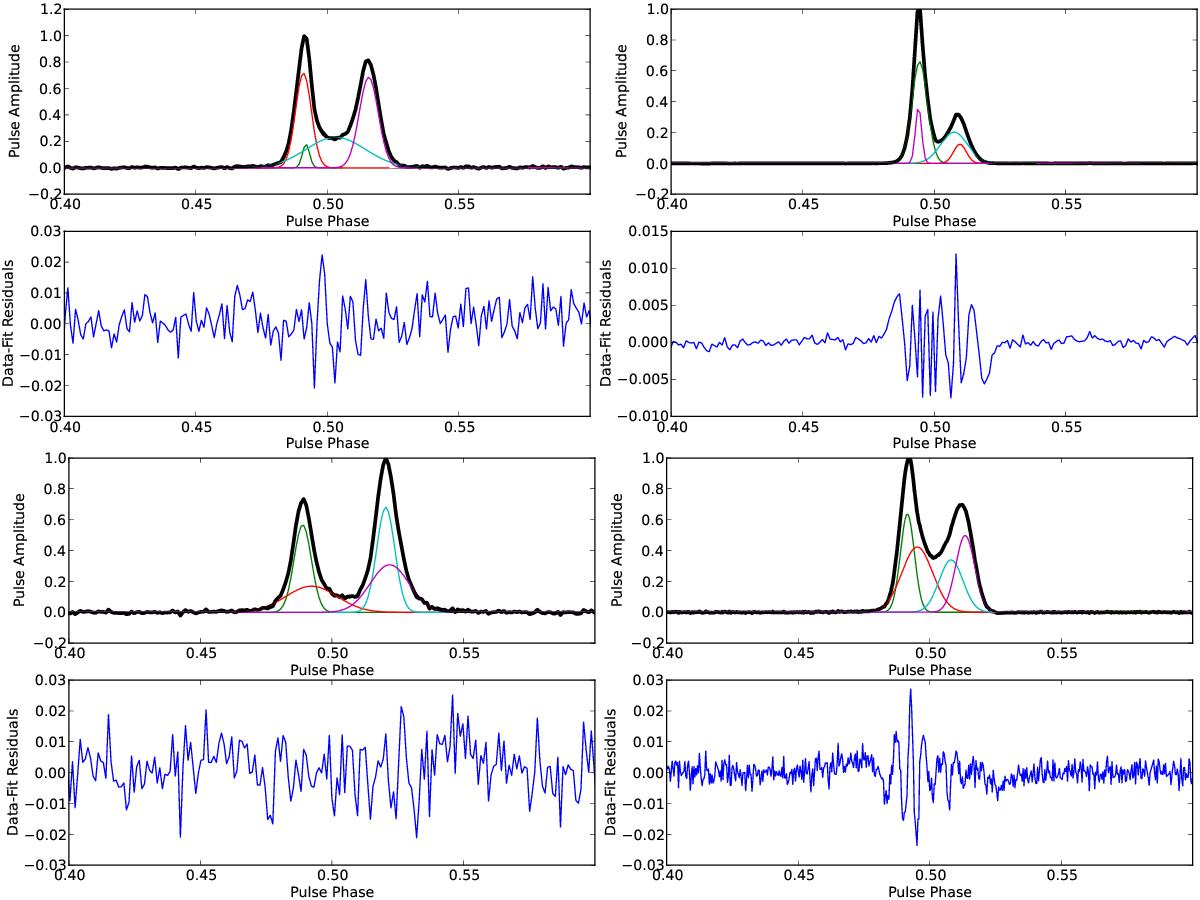
Gaussian modelling and resulting fit residuals for the pulse profile of PSR B1133+16 at four frequencies, between 0.4–0.6 in pulse phase. Top left: LOFAR HBA. Bottom left: LOFAR LBA. Top right: 1.4 GHz. Bottom right: 350 MHz. The Gaussian components contributing to the fit are shown in colours, while in black, overlapping the profile contours, we show the best fit obtained from them. It is evident that this standard “double” profile (see Sect. 5.1) is not well fit by only two Gaussians. Even adopting a higher number of components, the scatter of the residuals is not at the same level as the off-pulse residuals (this is the criterion that was adopted for the determination of a good fit, following Kramer et al. 1994). Nonetheless, when the residuals on-pulse were discrepant at the level of only a few percent from the ones off-pulse, we chose not to add more free parameters to the fit.
Current usage metrics show cumulative count of Article Views (full-text article views including HTML views, PDF and ePub downloads, according to the available data) and Abstracts Views on Vision4Press platform.
Data correspond to usage on the plateform after 2015. The current usage metrics is available 48-96 hours after online publication and is updated daily on week days.
Initial download of the metrics may take a while.