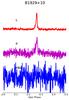
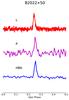
Fig. B.2
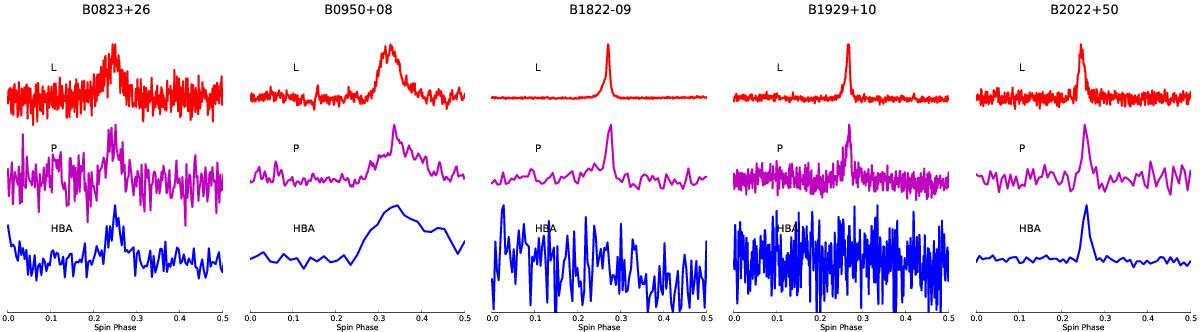
Zoom-in on the 0.0−0.5 phase longitude of the profile for the five pulsars in our sample that have interpulses. The plots are scaled so that each profile has the same rms and are renormalised to the peak of the interpulse at each frequency. In all cases LBA profiles were removed, as their signal-to-noise ratio and their channel smearing did not enable any estimate of the interpulse. The reference phase of the main pulse has been shifted by 0.75, relative to the main plots, to place the interpulse at the centre of the plot.
Current usage metrics show cumulative count of Article Views (full-text article views including HTML views, PDF and ePub downloads, according to the available data) and Abstracts Views on Vision4Press platform.
Data correspond to usage on the plateform after 2015. The current usage metrics is available 48-96 hours after online publication and is updated daily on week days.
Initial download of the metrics may take a while.