Fig. A.1
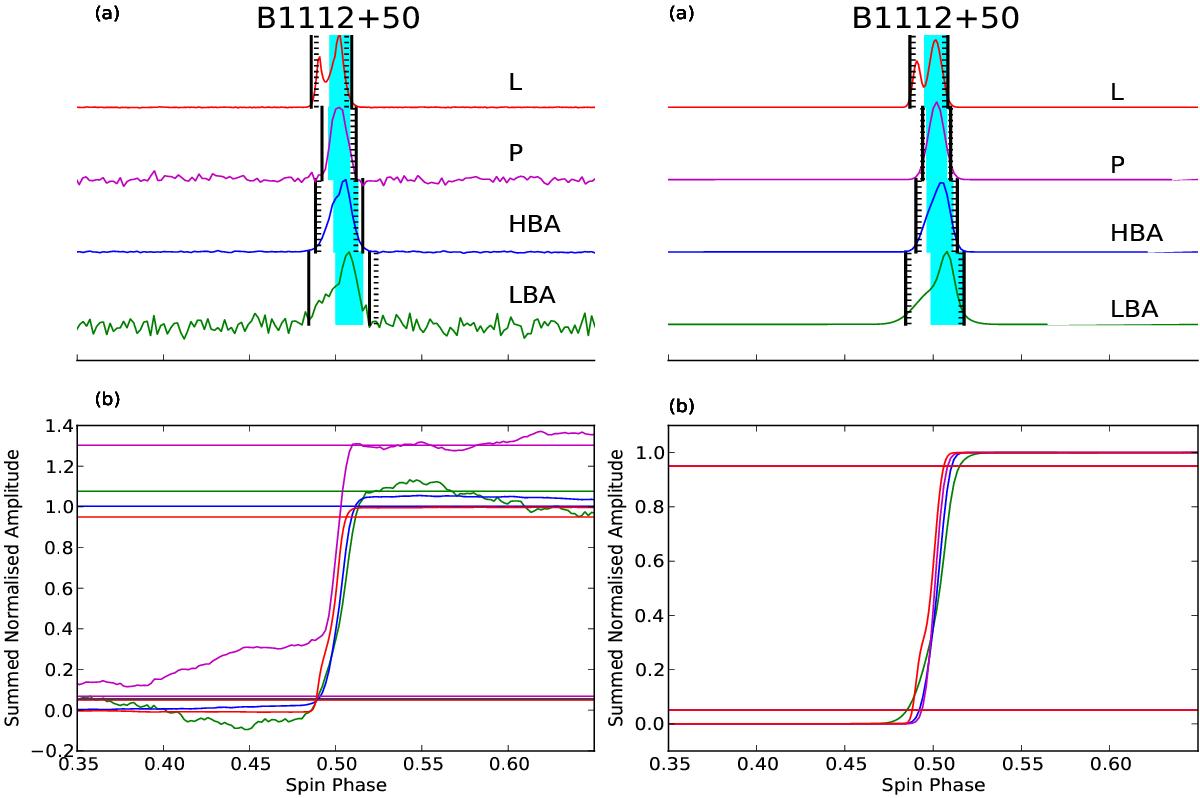
PSR B1112+50: example of how the widths of the full profile were calculated using the four methods described in the text. On the left-hand side is the real profile. On the right-hand side, for comparison, the noise-free profile obtained from the Gaussian fit. In panel a), the shaded cyan area represents weff. The dashed vertical lines represent wpow, calculated as shown in panel b): the cumulative distribution of the normalised profile. The solid line demarcates w10 as obtained from the Gaussian smoothed profiles (which are shown in panel a), on the right). The measurement of w10 is consistent and overlapping with wop (see text for details).
Current usage metrics show cumulative count of Article Views (full-text article views including HTML views, PDF and ePub downloads, according to the available data) and Abstracts Views on Vision4Press platform.
Data correspond to usage on the plateform after 2015. The current usage metrics is available 48-96 hours after online publication and is updated daily on week days.
Initial download of the metrics may take a while.