Free Access
Fig. 1
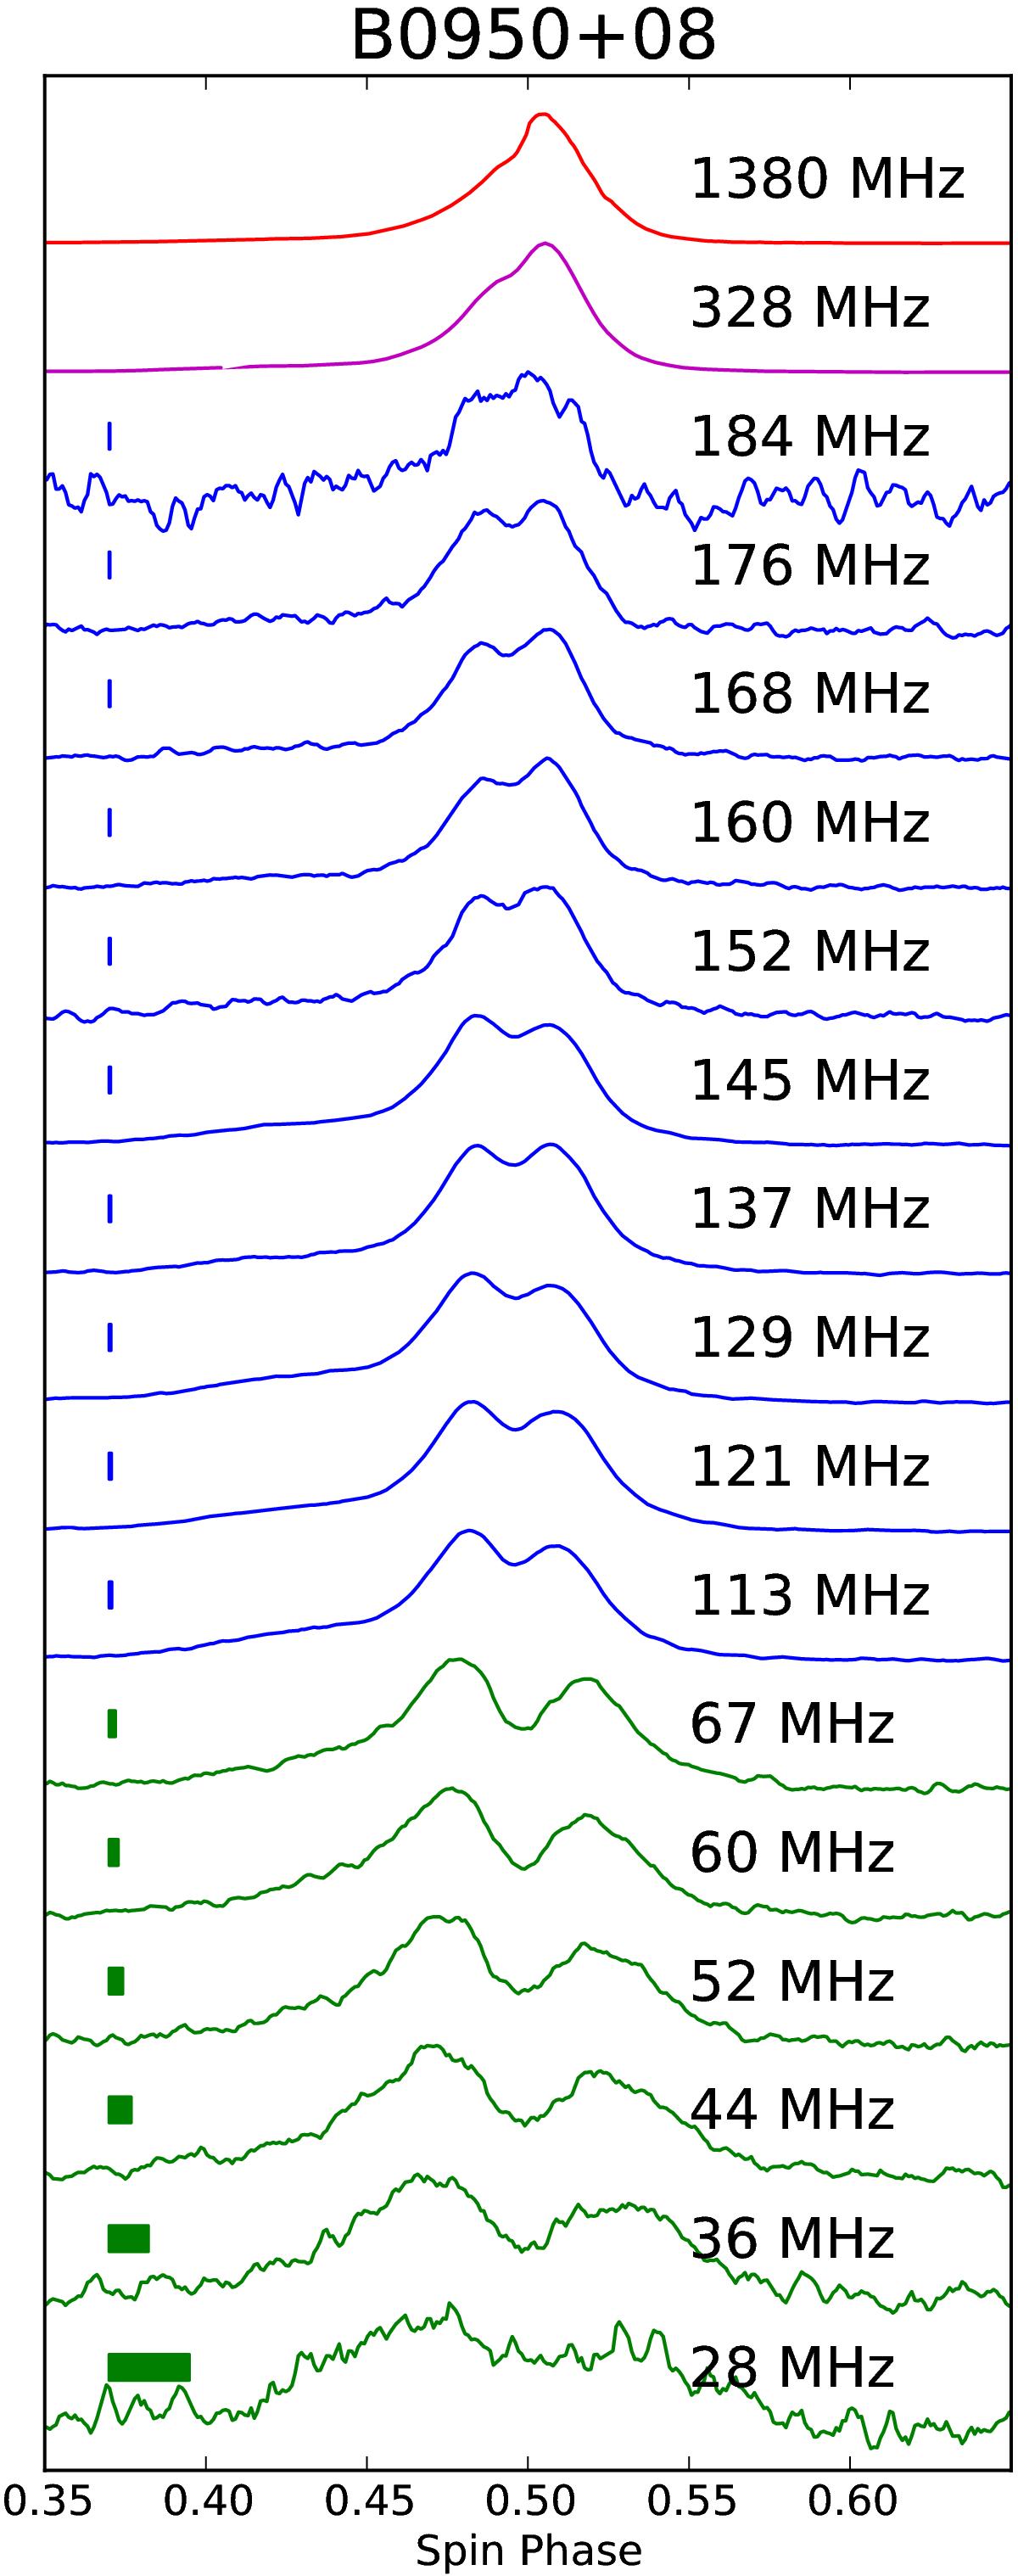
Example of pulsar profile evolution for PSR B0950+08, from 1400 MHz down to 30 MHz. It becomes more rapid at low frequencies. The bars on the left represent the intra-channel smearing due to uncorrected DM delay within a channel at each frequency. The profiles were aligned using a timing ephemeris (see text for details).
Current usage metrics show cumulative count of Article Views (full-text article views including HTML views, PDF and ePub downloads, according to the available data) and Abstracts Views on Vision4Press platform.
Data correspond to usage on the plateform after 2015. The current usage metrics is available 48-96 hours after online publication and is updated daily on week days.
Initial download of the metrics may take a while.