Fig. 9
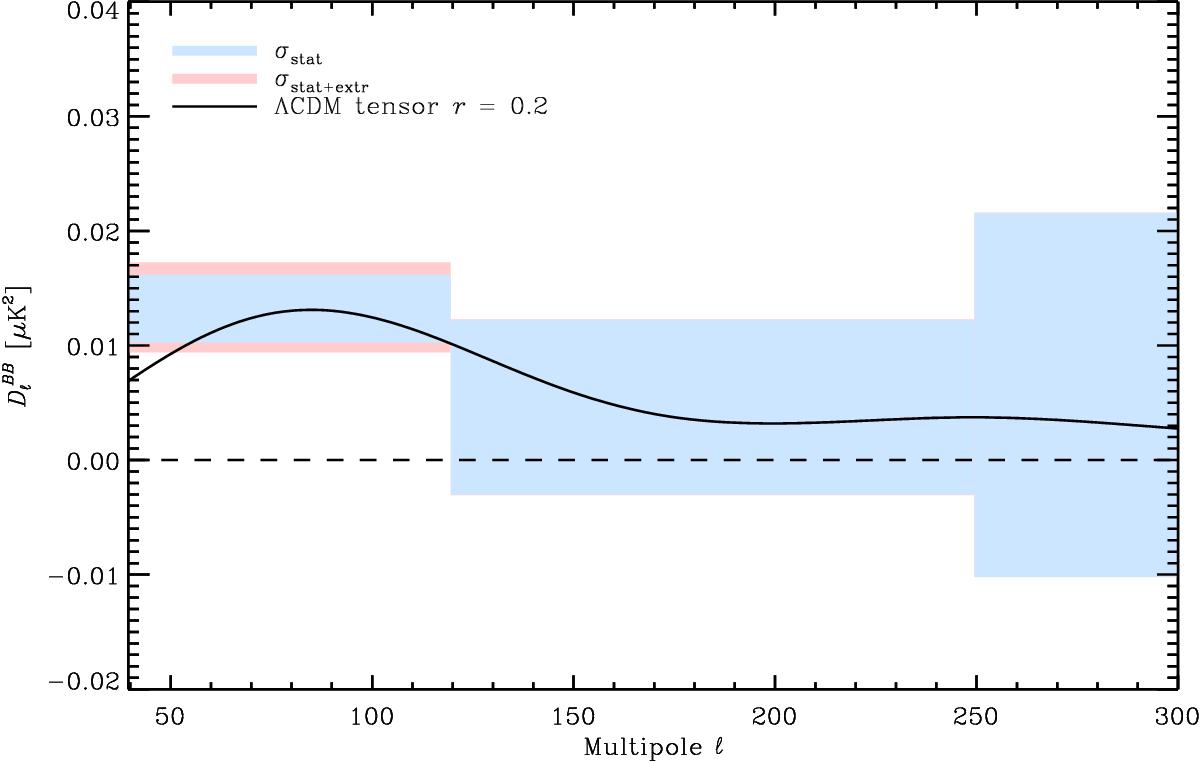
Planck 353 GHz ![]() angular power spectrum computed on
MB2 defined in Sect. 6.1 and extrapolated to 150 GHz (box centres). The
shaded boxes represent the ±
1σ uncertainties: blue for the statistical
uncertainties from noise; and red adding in quadrature the uncertainty from the
extrapolation to 150 GHz. The Planck 2013 best-fit ΛCDM
angular power spectrum computed on
MB2 defined in Sect. 6.1 and extrapolated to 150 GHz (box centres). The
shaded boxes represent the ±
1σ uncertainties: blue for the statistical
uncertainties from noise; and red adding in quadrature the uncertainty from the
extrapolation to 150 GHz. The Planck 2013 best-fit ΛCDM
![]() CMB model based on temperature
anisotropies, with a tensor amplitude fixed at r = 0.2, is
overplotted as a black line.
CMB model based on temperature
anisotropies, with a tensor amplitude fixed at r = 0.2, is
overplotted as a black line.
Current usage metrics show cumulative count of Article Views (full-text article views including HTML views, PDF and ePub downloads, according to the available data) and Abstracts Views on Vision4Press platform.
Data correspond to usage on the plateform after 2015. The current usage metrics is available 48-96 hours after online publication and is updated daily on week days.
Initial download of the metrics may take a while.