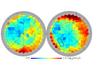
Fig. 8

Top: map in orthographic projection of the 150 GHz
![]() amplitudes at ℓ = 80, computed from
the Planck 353 GHz data, extrapolated to 150 GHz, and normalized by
the CMB expectation for tensor-to-scalar ratio r = 1. The colours
represent the estimated contamination from dust in rd units
(see details in Sect. 5.3). The logarithm of
the absolute value of rd for a 400 deg2 patch is presented in the
pixel on which the patch is centred. As described in Sect. 3.3.2, the patches overlap and so their properties are not
independent. The northern (southern) Galactic hemisphere is on the left
(right). The thick black contour outlines the
approximate BICEP2 deep-field region (see Sect. 6). Bottom: associated uncertainty, σ(rd).
amplitudes at ℓ = 80, computed from
the Planck 353 GHz data, extrapolated to 150 GHz, and normalized by
the CMB expectation for tensor-to-scalar ratio r = 1. The colours
represent the estimated contamination from dust in rd units
(see details in Sect. 5.3). The logarithm of
the absolute value of rd for a 400 deg2 patch is presented in the
pixel on which the patch is centred. As described in Sect. 3.3.2, the patches overlap and so their properties are not
independent. The northern (southern) Galactic hemisphere is on the left
(right). The thick black contour outlines the
approximate BICEP2 deep-field region (see Sect. 6). Bottom: associated uncertainty, σ(rd).

Current usage metrics show cumulative count of Article Views (full-text article views including HTML views, PDF and ePub downloads, according to the available data) and Abstracts Views on Vision4Press platform.
Data correspond to usage on the plateform after 2015. The current usage metrics is available 48-96 hours after online publication and is updated daily on week days.
Initial download of the metrics may take a while.