Fig. 4
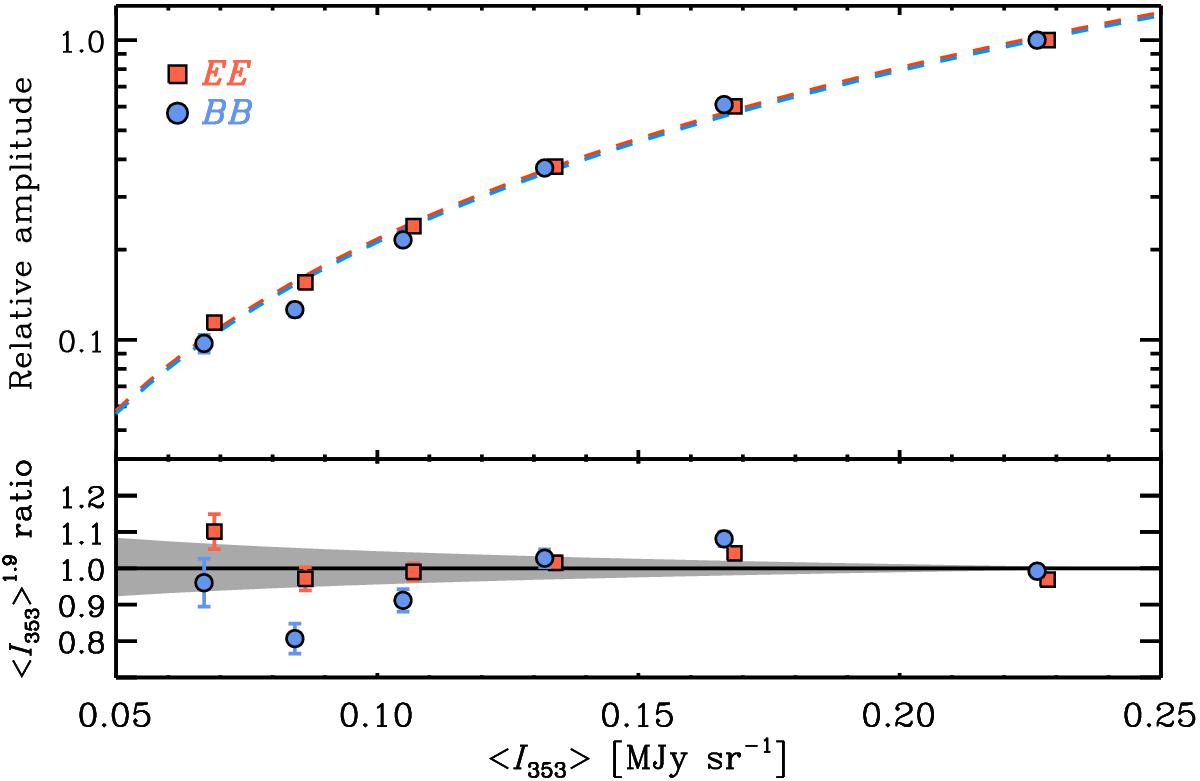
Amplitude of the dust AEE (red squares) and ABB (blue circles) power spectra, normalized with respect to the largest amplitude for each mode. These are plotted versus the mean dust intensity ⟨I353⟩ for the six LR regions (top panel). A power-law fit of the form AXX(⟨I353⟩)= KXX⟨I353⟩1.9, X ∈ { E,B }, is overplotted as a dashed line of the corresponding colour (these almost overlap). The bottom panel presents the ratio of the data and the fitted ⟨I353⟩1.9 power law; the range associated with the ± 1σ uncertainty in the power-law exponent of 1.9 is shown in grey. For details see Sect. 4.3.
Current usage metrics show cumulative count of Article Views (full-text article views including HTML views, PDF and ePub downloads, according to the available data) and Abstracts Views on Vision4Press platform.
Data correspond to usage on the plateform after 2015. The current usage metrics is available 48-96 hours after online publication and is updated daily on week days.
Initial download of the metrics may take a while.