Fig. 3
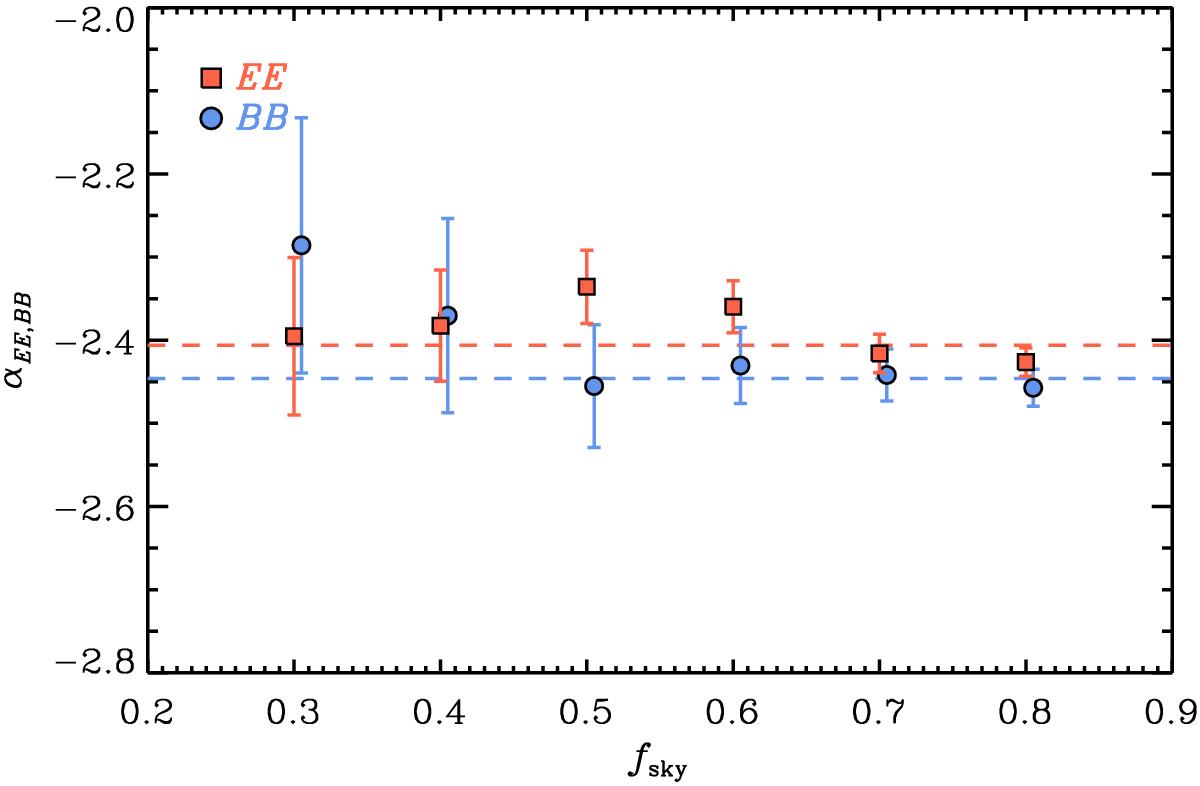
Best-fit power-law exponents αEE (red squares)
and αBB (blue
circles) fitted to the 353 GHz dust ![]() and
and
![]() power spectra for the different LR
regions defined in Sect. 3.3.1, distinguished
here with fsky. Although the values in the
regions are not quite independent, simple means have been calculated and are
represented as red and blue dashed lines.
power spectra for the different LR
regions defined in Sect. 3.3.1, distinguished
here with fsky. Although the values in the
regions are not quite independent, simple means have been calculated and are
represented as red and blue dashed lines.
Current usage metrics show cumulative count of Article Views (full-text article views including HTML views, PDF and ePub downloads, according to the available data) and Abstracts Views on Vision4Press platform.
Data correspond to usage on the plateform after 2015. The current usage metrics is available 48-96 hours after online publication and is updated daily on week days.
Initial download of the metrics may take a while.