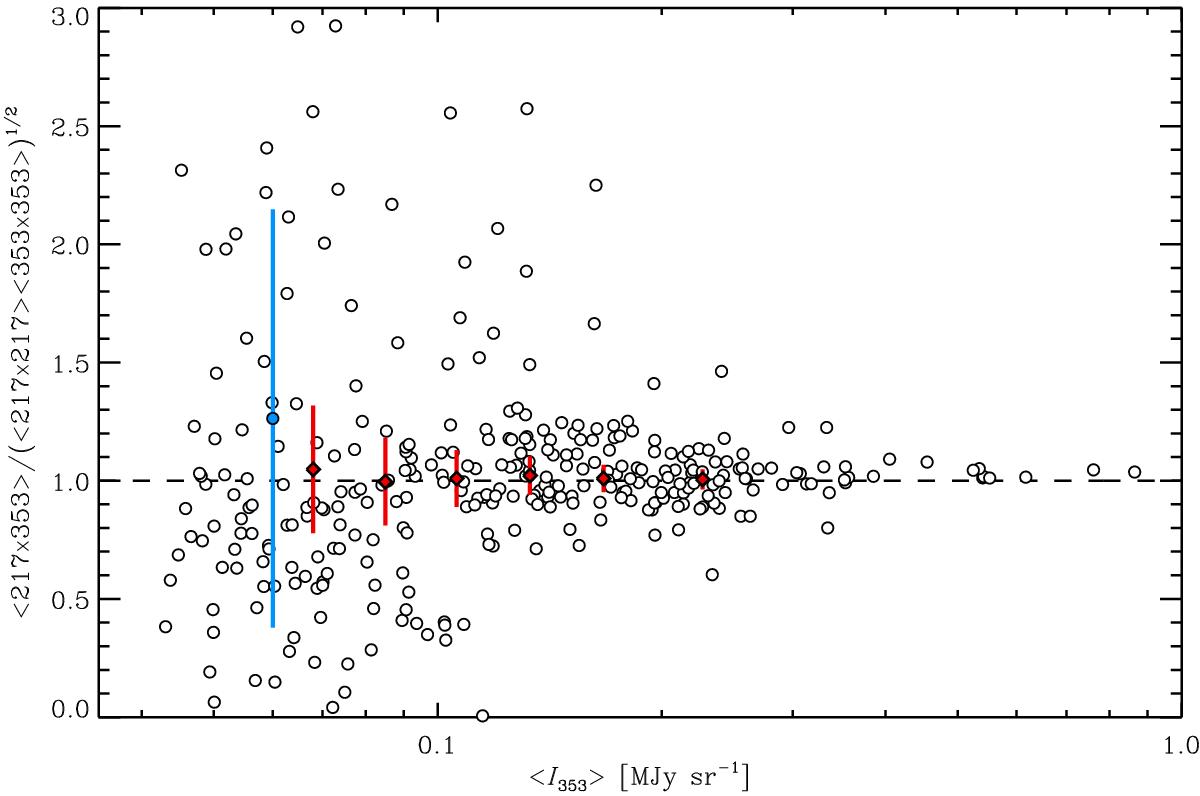
Fig. E.1
Ratio of the 217 ×
353![]() cross-spectrum amplitude with
respect to the geometrical mean between the 217 GHz and 353 GHz
cross-spectrum amplitude with
respect to the geometrical mean between the 217 GHz and 353 GHz
![]() auto-spectrum amplitudes, as a
function of ⟨I353⟩ for the region on which the
spectra are computed. These ratios are presented for the 352 patches of Sect. 5 (black circles, with error bars not presented
for the sake of clarity), for the six LR regions of Sect. 4 (red diamonds) and for the MB2 region
of Sect. 6 (blue diamond).
auto-spectrum amplitudes, as a
function of ⟨I353⟩ for the region on which the
spectra are computed. These ratios are presented for the 352 patches of Sect. 5 (black circles, with error bars not presented
for the sake of clarity), for the six LR regions of Sect. 4 (red diamonds) and for the MB2 region
of Sect. 6 (blue diamond).
Current usage metrics show cumulative count of Article Views (full-text article views including HTML views, PDF and ePub downloads, according to the available data) and Abstracts Views on Vision4Press platform.
Data correspond to usage on the plateform after 2015. The current usage metrics is available 48-96 hours after online publication and is updated daily on week days.
Initial download of the metrics may take a while.