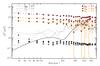
Fig. 2

Planck HFI 353 GHz ![]() (red, top) and
(red, top) and
![]() (blue, bottom)
power spectra (in μK
(blue, bottom)
power spectra (in μK![]() ) computed on three of the selected
LR analysis regions that have fsky = 0.3 (circles, lightest),
fsky =
0.5 (diamonds, medium) and fsky = 0.7
(squares, darkest). The uncertainties shown are ± 1σ. The best-fit
power laws in ℓ are given for each spectrum as a dashed line
of the corresponding colour. The Planck 2013 best-fit
ΛCDM
) computed on three of the selected
LR analysis regions that have fsky = 0.3 (circles, lightest),
fsky =
0.5 (diamonds, medium) and fsky = 0.7
(squares, darkest). The uncertainties shown are ± 1σ. The best-fit
power laws in ℓ are given for each spectrum as a dashed line
of the corresponding colour. The Planck 2013 best-fit
ΛCDM
![]() expectation (Planck Collaboration XVI 2014) and the corresponding
r =
0.2
expectation (Planck Collaboration XVI 2014) and the corresponding
r =
0.2![]() CMB model are shown as solid black
lines; the rise for ℓ> 200 is from the lensing contribution. In
the lower parts of each panel, the global estimates of the power spectra of the
systematic effects responsible for intensity-to-polarization leakage (Sect. 2.3) are shown in different shades of grey, with
the same symbols to identify the three regions. Finally, absolute values of the
null-test spectra anticipated in Sect. 2.3,
computed here from the cross-spectra of the HalfRing/DetSet differences (see text),
are represented as dashed-dotted, dashed, and dotted grey lines for the three LR
regions.
CMB model are shown as solid black
lines; the rise for ℓ> 200 is from the lensing contribution. In
the lower parts of each panel, the global estimates of the power spectra of the
systematic effects responsible for intensity-to-polarization leakage (Sect. 2.3) are shown in different shades of grey, with
the same symbols to identify the three regions. Finally, absolute values of the
null-test spectra anticipated in Sect. 2.3,
computed here from the cross-spectra of the HalfRing/DetSet differences (see text),
are represented as dashed-dotted, dashed, and dotted grey lines for the three LR
regions.
Current usage metrics show cumulative count of Article Views (full-text article views including HTML views, PDF and ePub downloads, according to the available data) and Abstracts Views on Vision4Press platform.
Data correspond to usage on the plateform after 2015. The current usage metrics is available 48-96 hours after online publication and is updated daily on week days.
Initial download of the metrics may take a while.