Fig. D.2
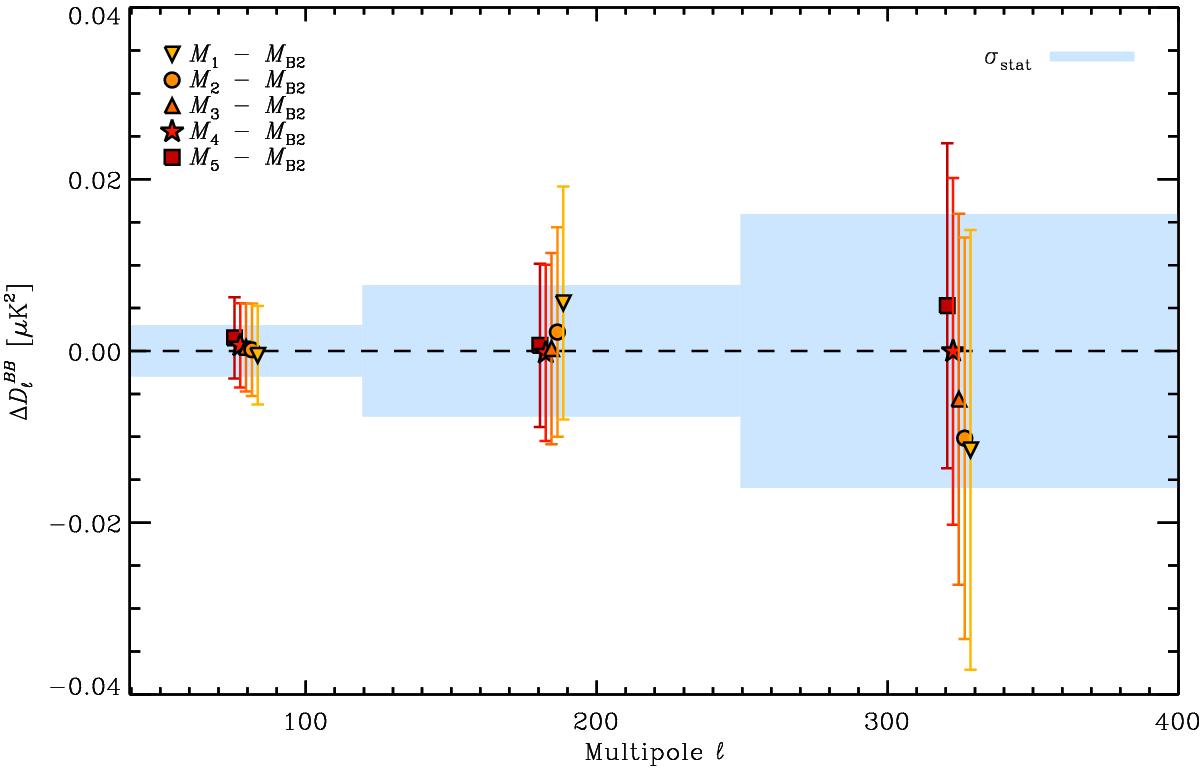
Planck 353 GHz ![]() angular power spectrum differences
extrapolated to 150 GHz, determined from the spectra computed on the
M1−5 regions presented in Appendix
D.2 and the spectrum computed on
MB2.
angular power spectrum differences
extrapolated to 150 GHz, determined from the spectra computed on the
M1−5 regions presented in Appendix
D.2 and the spectrum computed on
MB2.
![]() difference values for the five
regions are shown using colours from yellow (for M1) to
dark red (for M5). As in Fig. 9, the blue boxes represent the statistical
uncertainties from noise associated with the MB2
spectrum. They are centred on zero because we compute spectrum differences here.
difference values for the five
regions are shown using colours from yellow (for M1) to
dark red (for M5). As in Fig. 9, the blue boxes represent the statistical
uncertainties from noise associated with the MB2
spectrum. They are centred on zero because we compute spectrum differences here.
Current usage metrics show cumulative count of Article Views (full-text article views including HTML views, PDF and ePub downloads, according to the available data) and Abstracts Views on Vision4Press platform.
Data correspond to usage on the plateform after 2015. The current usage metrics is available 48-96 hours after online publication and is updated daily on week days.
Initial download of the metrics may take a while.