Fig. D.1
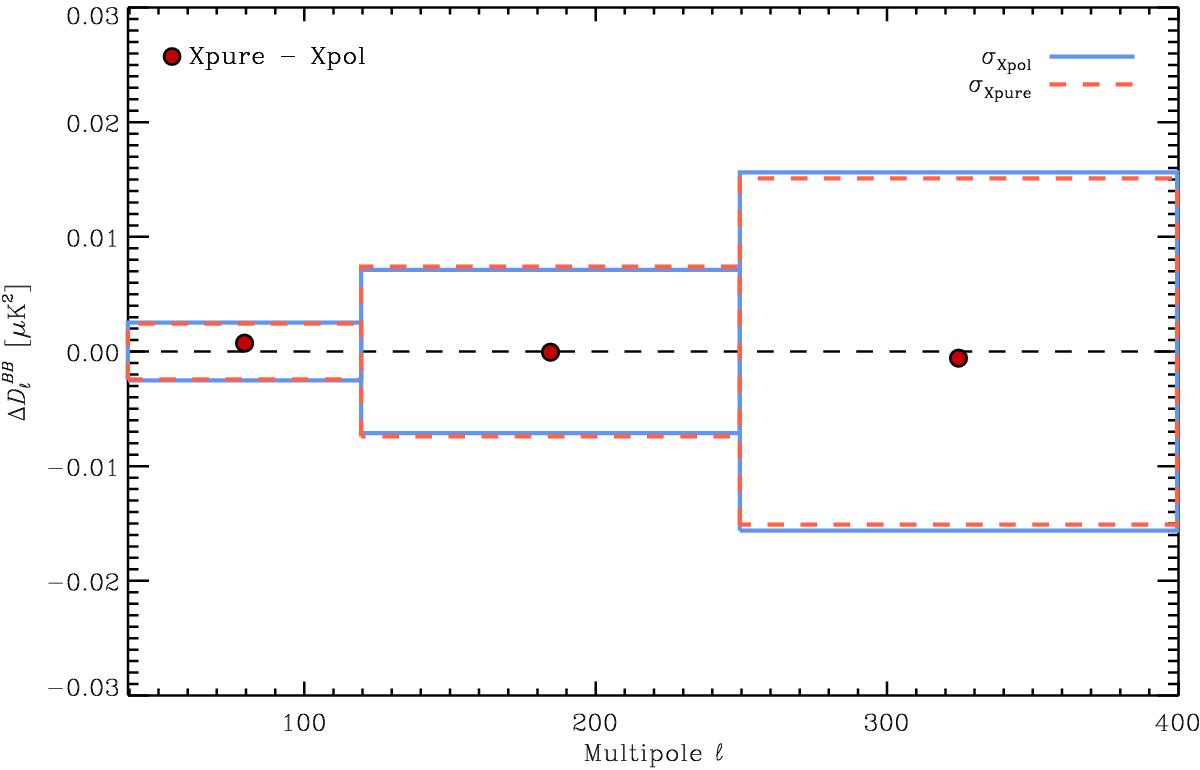
Xpol minus XpurePlanck 353 GHz
![]() angular power spectrum differences
extrapolated to 150 GHz, computed from the cross-DetSets on MB2 (red
circles). The blue boxes represent the ± 1σ errors computed using Xpol from the data
on MB2, while the dashed orange boxes
are the Xpure±
1σ errors coming from Monte Carlo simulations
of Planck noise.
angular power spectrum differences
extrapolated to 150 GHz, computed from the cross-DetSets on MB2 (red
circles). The blue boxes represent the ± 1σ errors computed using Xpol from the data
on MB2, while the dashed orange boxes
are the Xpure±
1σ errors coming from Monte Carlo simulations
of Planck noise.
Current usage metrics show cumulative count of Article Views (full-text article views including HTML views, PDF and ePub downloads, according to the available data) and Abstracts Views on Vision4Press platform.
Data correspond to usage on the plateform after 2015. The current usage metrics is available 48-96 hours after online publication and is updated daily on week days.
Initial download of the metrics may take a while.