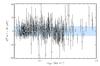
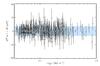
Fig. C.1

Top: same as Fig. 7, but
instead of computing the ![]() (top panel) and
(top panel) and
![]() (bottom panel)
spectra from the 353 GHz cross-correlation between DetSet1 and DetSet2, we compute
them from the cross-correlation between the HalfRing half-differences for each
detector set, i.e., (353DS1,HR1−353DS1,HR2)/2 ×
(353DS2,HR1−353DS2,HR2)/2. The
3σ
expectations from Planck inhomogeneous white-noise Monte Carlo
simulations are represented as light blue shaded areas.
(bottom panel)
spectra from the 353 GHz cross-correlation between DetSet1 and DetSet2, we compute
them from the cross-correlation between the HalfRing half-differences for each
detector set, i.e., (353DS1,HR1−353DS1,HR2)/2 ×
(353DS2,HR1−353DS2,HR2)/2. The
3σ
expectations from Planck inhomogeneous white-noise Monte Carlo
simulations are represented as light blue shaded areas.
Current usage metrics show cumulative count of Article Views (full-text article views including HTML views, PDF and ePub downloads, according to the available data) and Abstracts Views on Vision4Press platform.
Data correspond to usage on the plateform after 2015. The current usage metrics is available 48-96 hours after online publication and is updated daily on week days.
Initial download of the metrics may take a while.