Fig. A.1
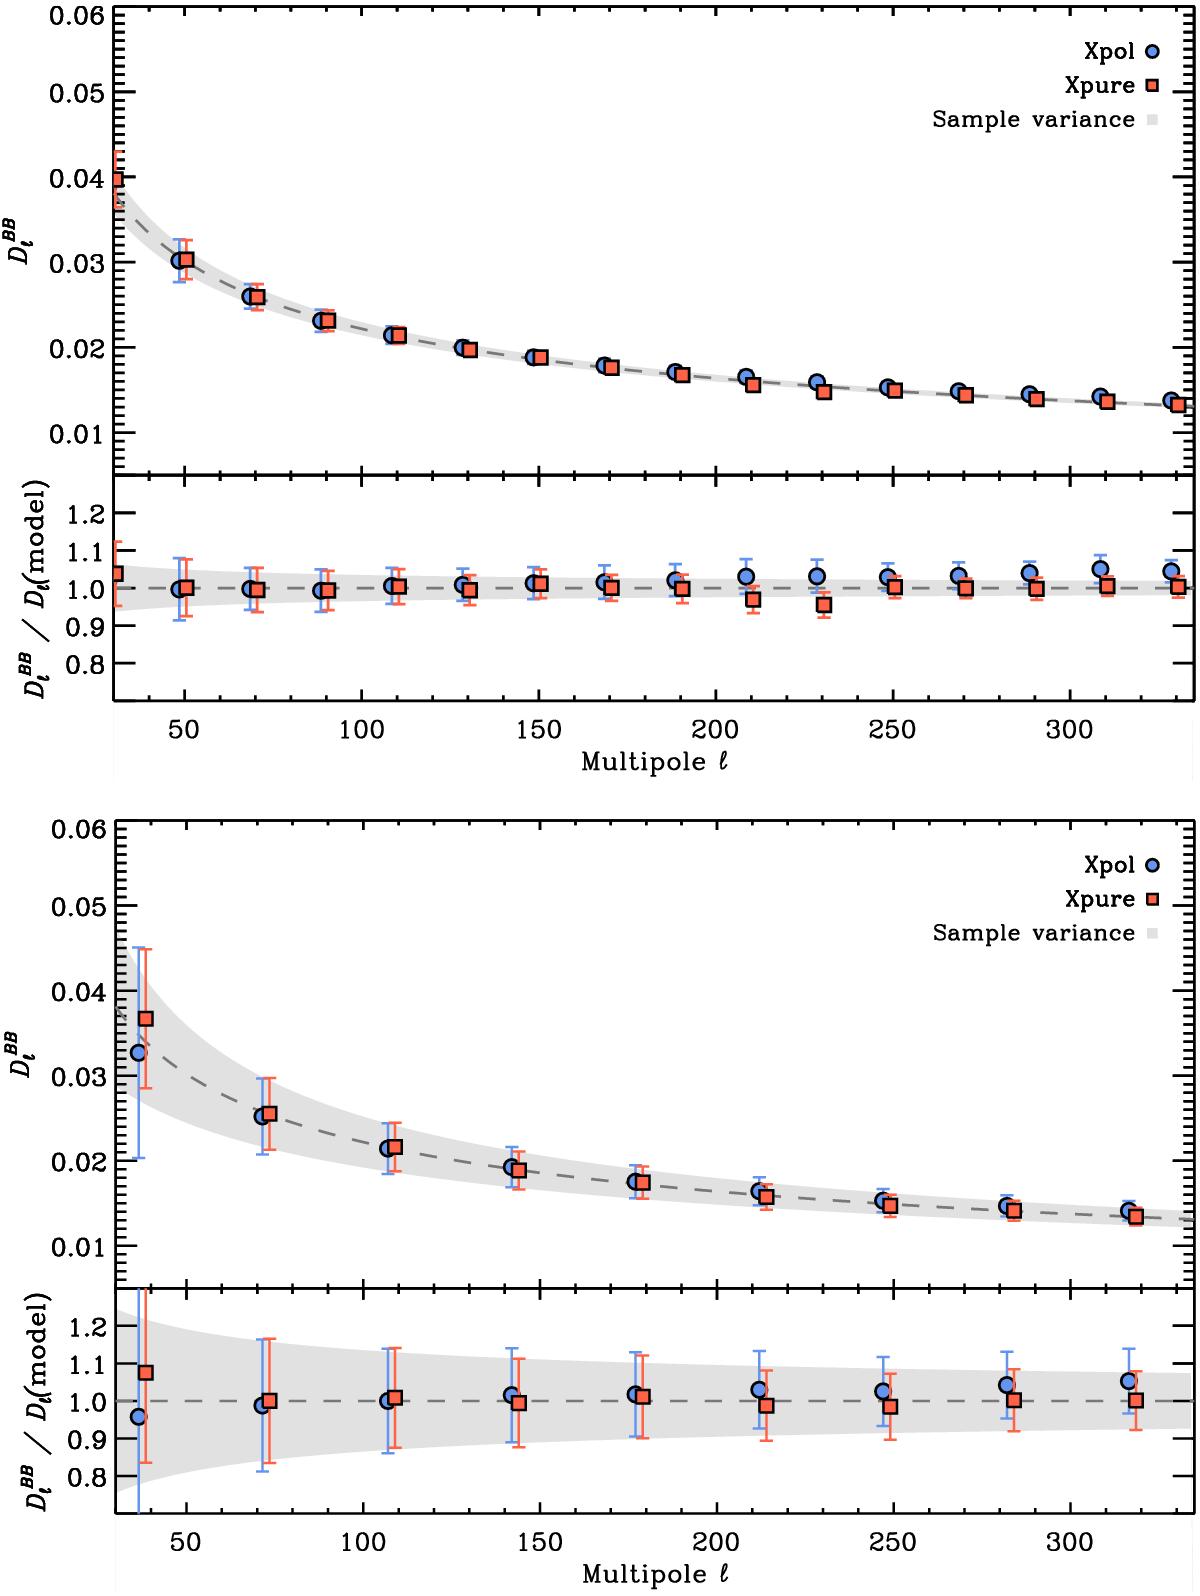
Upper parts of both panels: performance of the
Xpol (blue points, see Sect. 3.1.1) and Xpure
(red squares, see Sect. 3.1.2) algorithms on
the ![]() power spectrum for Gaussian
simulations of the dust polarization in the LR24 region (top panel,
defined in Sect. 3.3.1) and in MB2
(bottom panel, defined in Sect. 6.1). The signal input power spectrum is shown as a dashed grey line and
its associated sample variance as a light grey shaded area. Lower parts of
both panels: relative discrepancy with respect to the input power
spectrum.
power spectrum for Gaussian
simulations of the dust polarization in the LR24 region (top panel,
defined in Sect. 3.3.1) and in MB2
(bottom panel, defined in Sect. 6.1). The signal input power spectrum is shown as a dashed grey line and
its associated sample variance as a light grey shaded area. Lower parts of
both panels: relative discrepancy with respect to the input power
spectrum.
Current usage metrics show cumulative count of Article Views (full-text article views including HTML views, PDF and ePub downloads, according to the available data) and Abstracts Views on Vision4Press platform.
Data correspond to usage on the plateform after 2015. The current usage metrics is available 48-96 hours after online publication and is updated daily on week days.
Initial download of the metrics may take a while.