Fig. 8
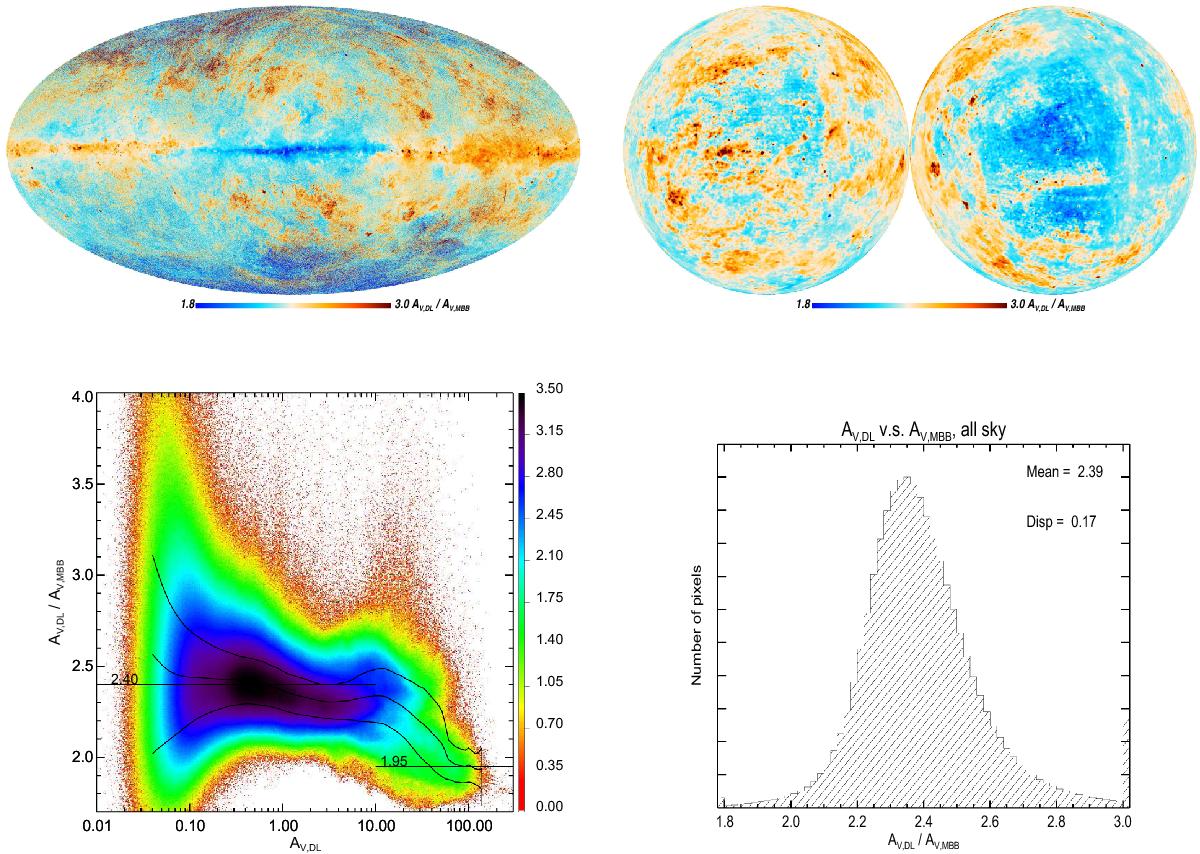
Comparison between DL and MBB AV estimates, denotedAV,DL andAV,MBB respectively. The top row shows the ratio of theAV,MBB andAV,DL maps. The polar projection maps are smoothed to 1° resolution to highlight the systematic departures. The bottom row shows the ratio of theAV,MBB andAV,DL estimates as a function of theAV,DL estimate (left) and its histogram (right). In the bottom left panel the colour corresponds to the logarithm of the density of points (see Fig. 5). The curves correspond to the mean value and the ± 1σ dispersion. TheAV,DL andAV,MBB values used in this comparison are derived from a fit of the same data sets.
Current usage metrics show cumulative count of Article Views (full-text article views including HTML views, PDF and ePub downloads, according to the available data) and Abstracts Views on Vision4Press platform.
Data correspond to usage on the plateform after 2015. The current usage metrics is available 48-96 hours after online publication and is updated daily on week days.
Initial download of the metrics may take a while.