Fig. 7
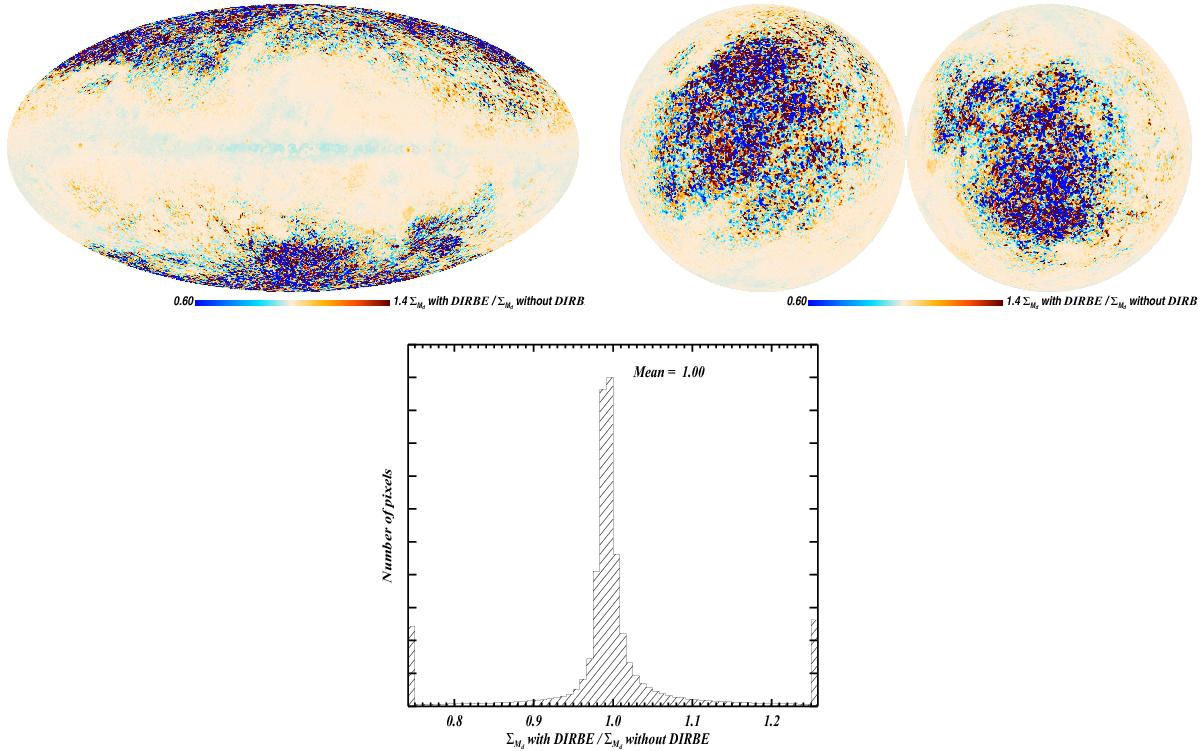
Comparison between the dust mass estimates obtained with and without the DIRBE 140 and DIRBE 240 photometric constraints. The top row shows maps of the ratio between the two dust mass estimates, and the bottom row shows the corresponding histogram. Both model fits are performed using a 1° FWHM Gaussian PSF. The difference between the dust mass estimates is relatively small (within a few percent) and so it is safe to perform a modelling of the sky without the DIRBE constraints. In the bottom row, the points below 0.8 and over 1.2 were added to the 0.8 and 1.2 bars, respectively.
Current usage metrics show cumulative count of Article Views (full-text article views including HTML views, PDF and ePub downloads, according to the available data) and Abstracts Views on Vision4Press platform.
Data correspond to usage on the plateform after 2015. The current usage metrics is available 48-96 hours after online publication and is updated daily on week days.
Initial download of the metrics may take a while.