Fig. 6
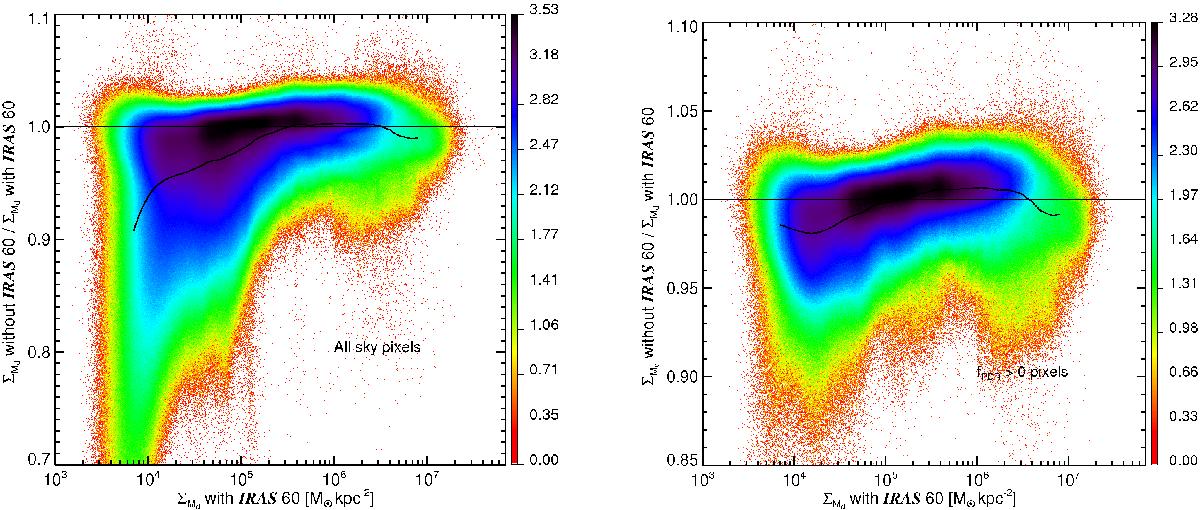
Comparison between the dust mass estimates when the IRAS 60 constraint is excluded or included in the fit. The left panel shows all the sky pixels, and the right panel only the fPDR> 0 pixels. The vertical axis corresponds to the ratio of the inferred mass density of a fit without using the IRAS 60 constraint to that obtained when this constraint is present (see text). Colour corresponds to the logarithm of the density of points (see Fig. 5). The curve corresponds to the mean value.
Current usage metrics show cumulative count of Article Views (full-text article views including HTML views, PDF and ePub downloads, according to the available data) and Abstracts Views on Vision4Press platform.
Data correspond to usage on the plateform after 2015. The current usage metrics is available 48-96 hours after online publication and is updated daily on week days.
Initial download of the metrics may take a while.