Free Access
Fig. B.3
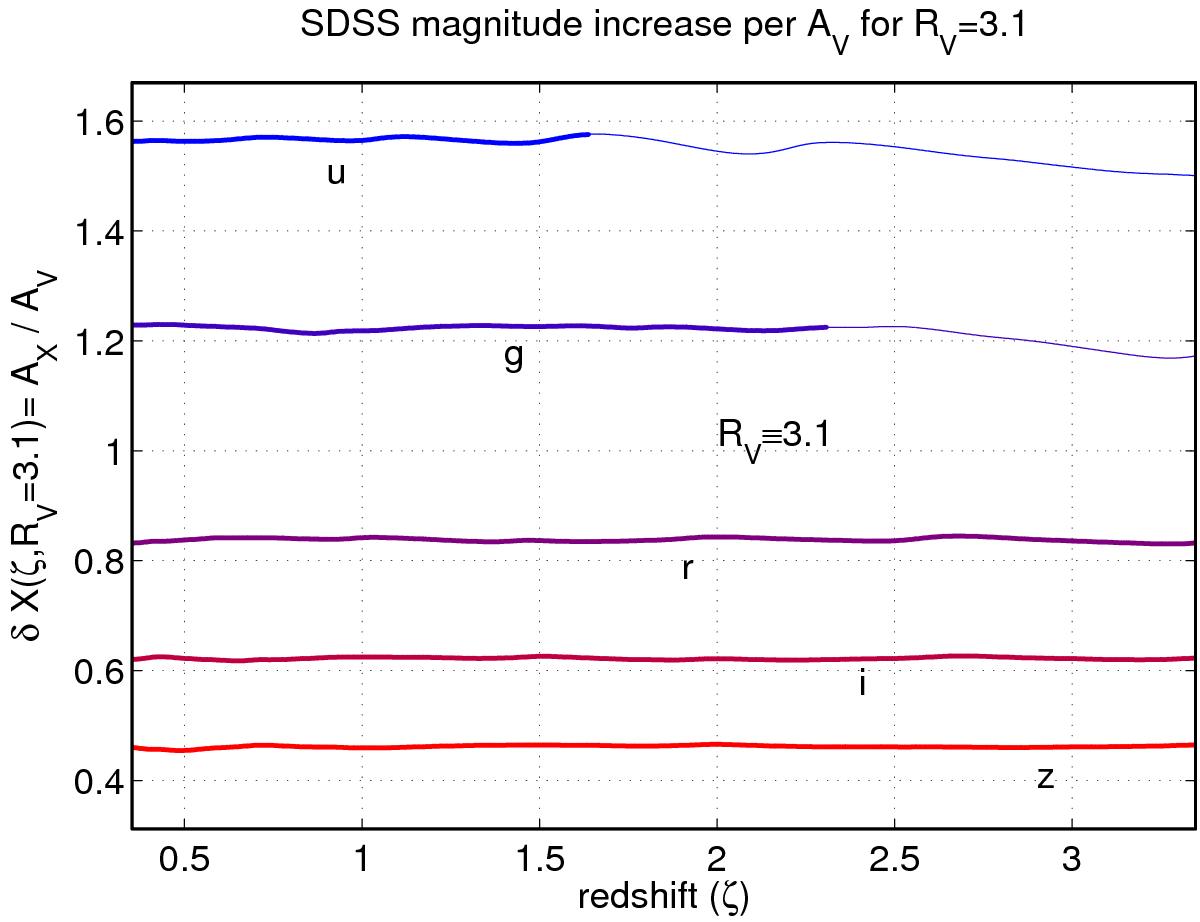
QSO magnitude increase per unit of dust extinction AV as a function of the QSO redshift. We use an extinction curve with RV = 3.1. The u and g band curves are shown in a thinner trace for ζ> 1.64 and ζ> 2.31, the redshifts at which the intergalactic Lyα line can affect the photometry in these bands.
Current usage metrics show cumulative count of Article Views (full-text article views including HTML views, PDF and ePub downloads, according to the available data) and Abstracts Views on Vision4Press platform.
Data correspond to usage on the plateform after 2015. The current usage metrics is available 48-96 hours after online publication and is updated daily on week days.
Initial download of the metrics may take a while.