Fig. B.2
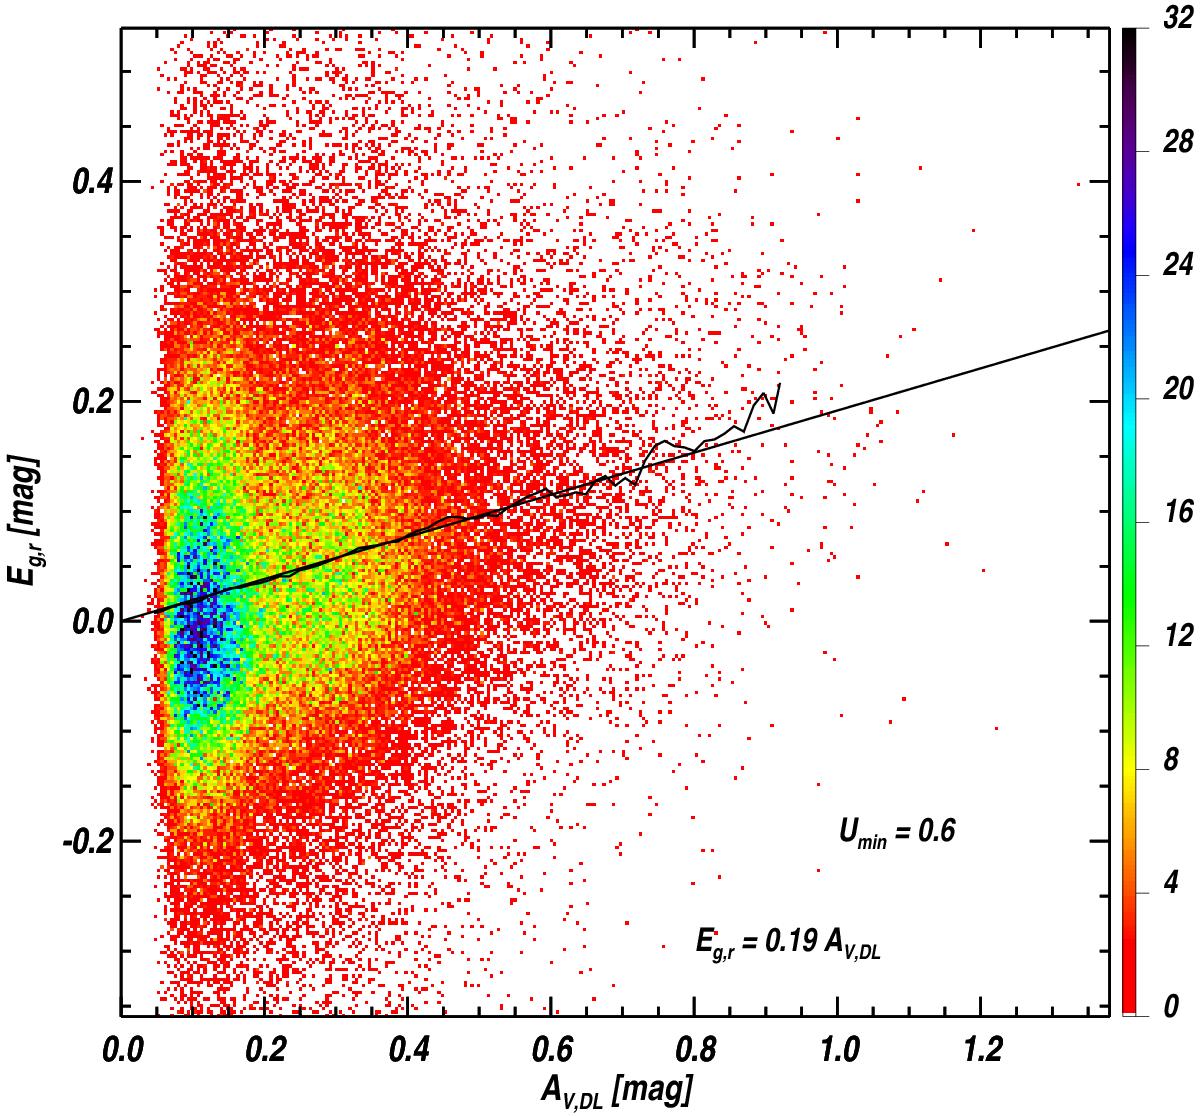
Colour excess Eg,r versusAV,DL for the QSOs with Umin = 0.6. Colour corresponds to the density of points (see Fig. 5). The straight line corresponds to the best fit for all the QSOs. For eachAV,DL, the black curve corresponds to the mean Eg,r for the QSOs in an interval with a half-width δAV,DL = 0.01. Even though the QSOs show significant scatter, the Eg,r versusAV,DL relationship is very linear; the mean Eg,r for eachAV,DL curve does not show significant departures from the straight line.
Current usage metrics show cumulative count of Article Views (full-text article views including HTML views, PDF and ePub downloads, according to the available data) and Abstracts Views on Vision4Press platform.
Data correspond to usage on the plateform after 2015. The current usage metrics is available 48-96 hours after online publication and is updated daily on week days.
Initial download of the metrics may take a while.