Fig. B.1
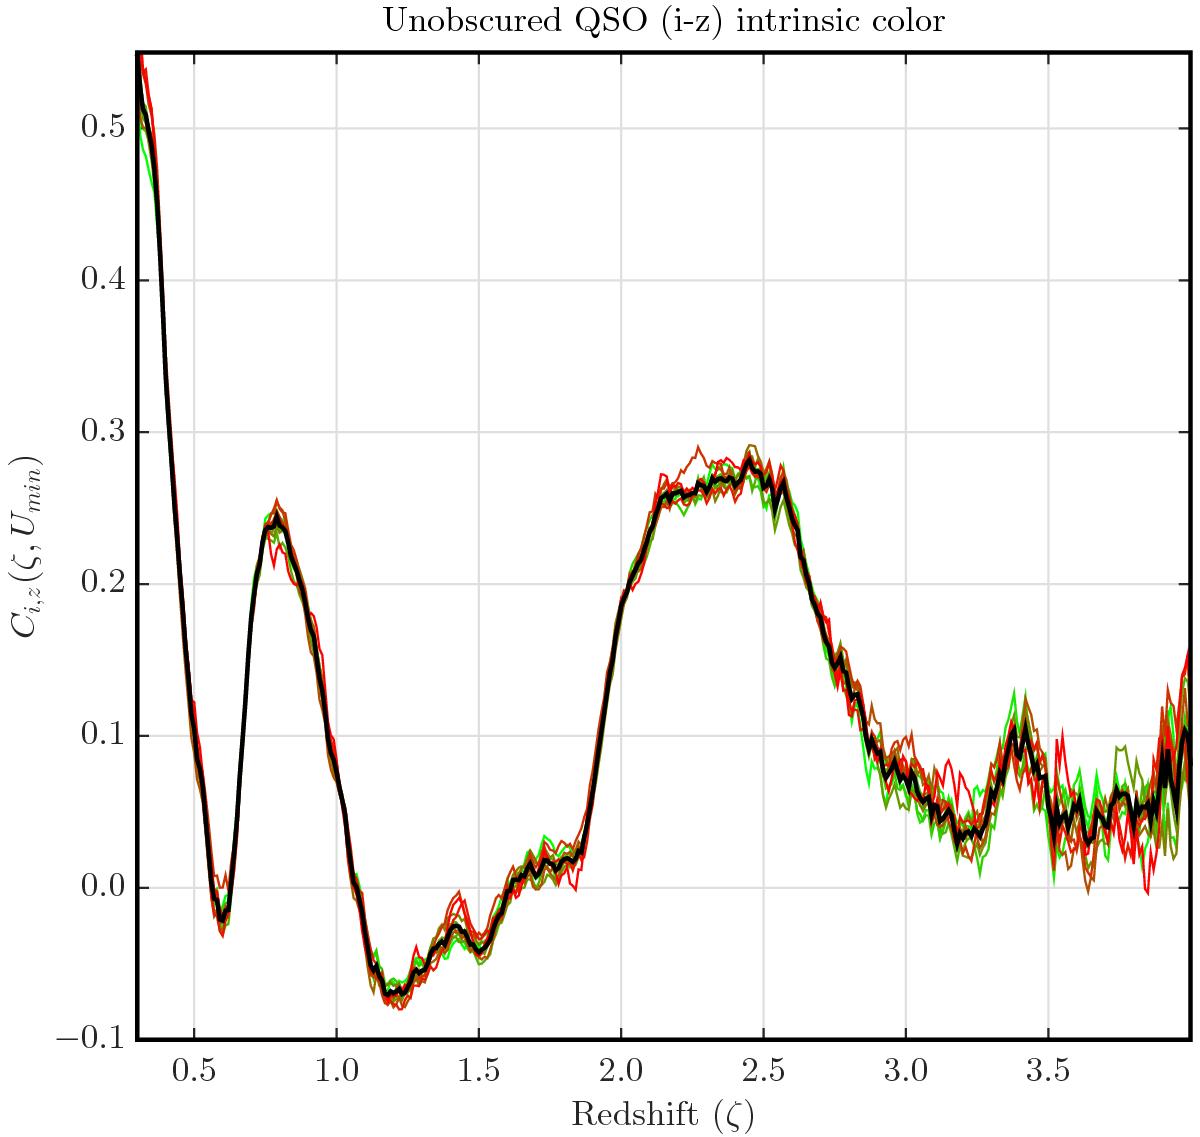
Unobscured QSO intrinsic colours, as a function of redshift (ζ), for the bands i and z. The functions Ci,z(ζ,Umin), are shown for the different values of Umin, using redder traces for larger Umin, and greener for smaller Umin. Their weighted mean Ci,z(ζ) is shown in black. The Lyα line affects the i band photometry for ζ> 4.62, but we restrict our analysis to ζ< 3.35 to have enough QSOs per redshift interval. For ζ> 3.35 the estimated Ci,z(ζ) becomes noisy.
Current usage metrics show cumulative count of Article Views (full-text article views including HTML views, PDF and ePub downloads, according to the available data) and Abstracts Views on Vision4Press platform.
Data correspond to usage on the plateform after 2015. The current usage metrics is available 48-96 hours after online publication and is updated daily on week days.
Initial download of the metrics may take a while.